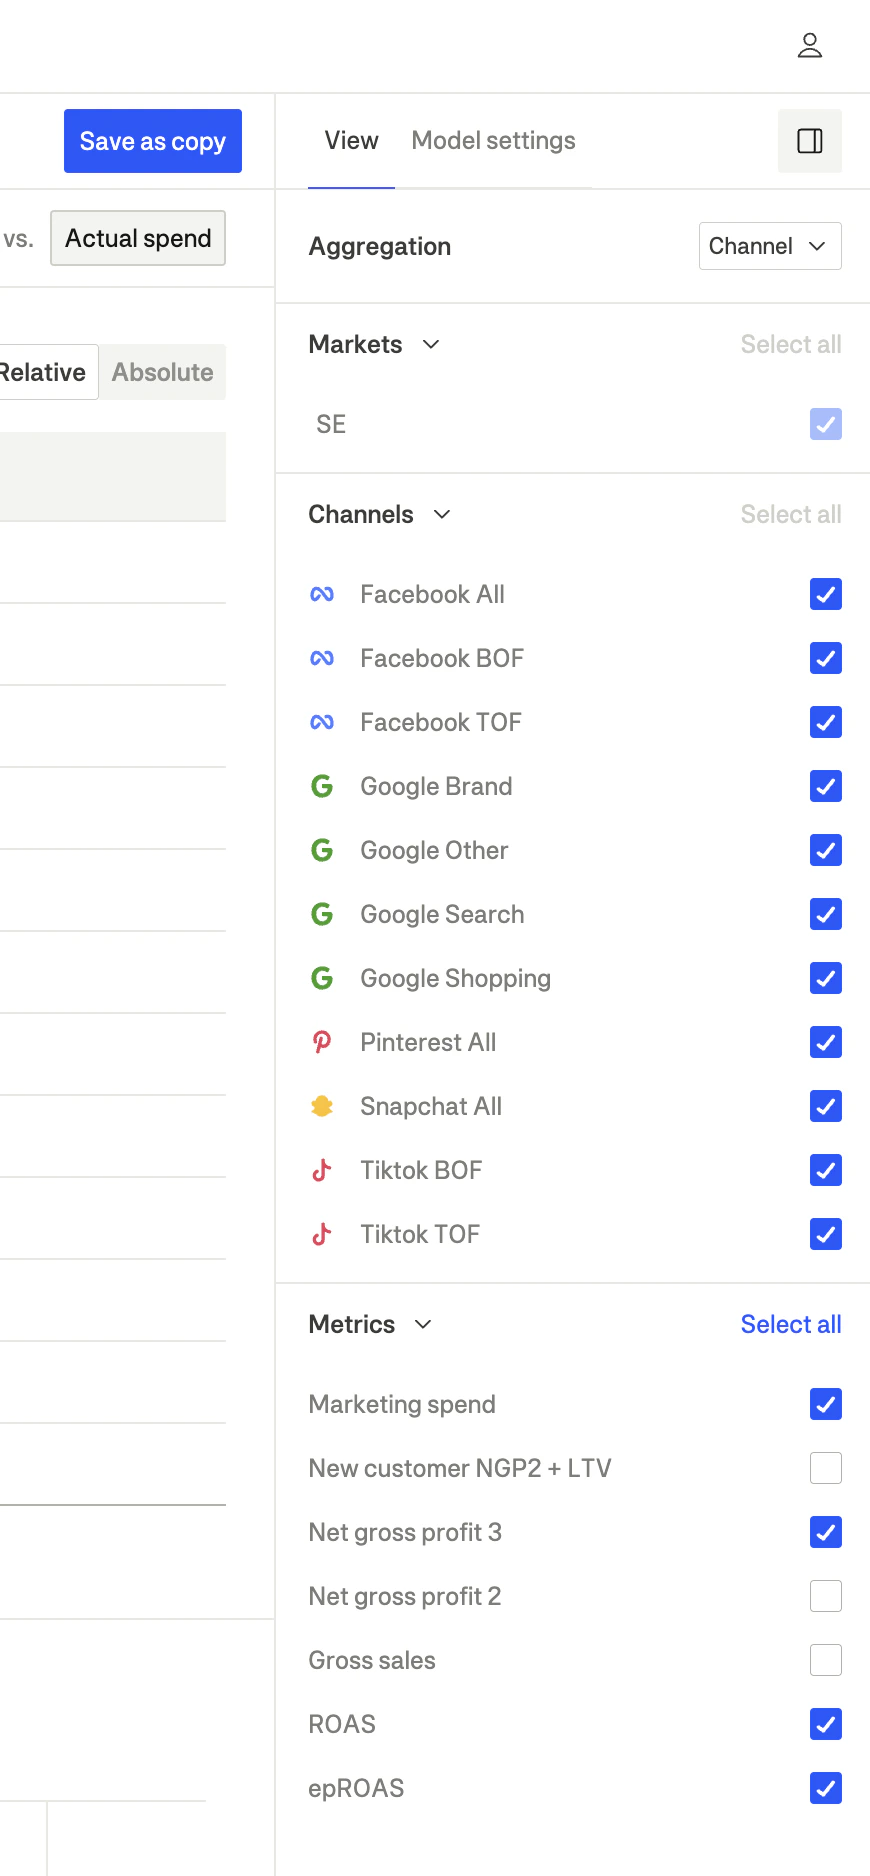
The View panel allows you to customize what data is displayed in the MMM interface. Access it by clicking the “View” tab in the right sidebar.
Aggregation
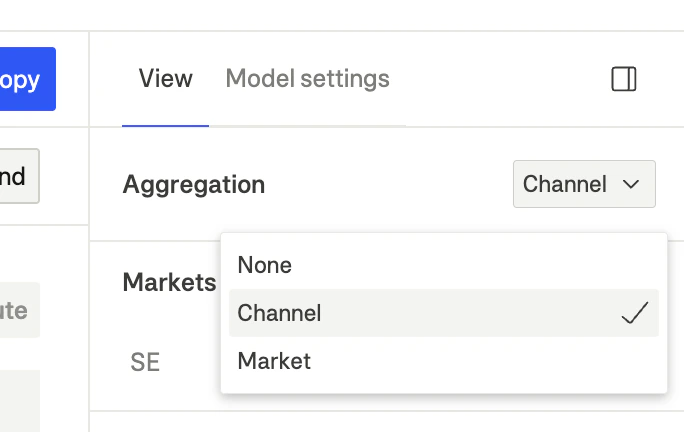
The aggregation setting controls how data is grouped in tables and charts. This is a powerful pivot feature that lets you analyze your data from different perspectives.
| Mode | Description | Use case |
|---|
| Channel | Data is aggregated by marketing channel across all markets | Compare channel performance across your entire business |
| Market | Data is aggregated by geographic market across all channels | Identify which regions have the most optimization potential |
| None | Data is shown at the channel × market level (most granular) | Deep-dive analysis into specific channel-market combinations |
How aggregation affects the view
When you change the aggregation setting:
- Tables: Rows will group by your selected dimension (channel or market)
- Charts: Visualizations will show data aggregated accordingly
- Metrics: Values are summed or averaged based on the aggregation level
Use Channel aggregation to compare channel performance across your entire business. Switch to Market aggregation to identify which geographic regions have the most optimization potential. Use None for the most detailed analysis when you need to see specific channel-market combinations.
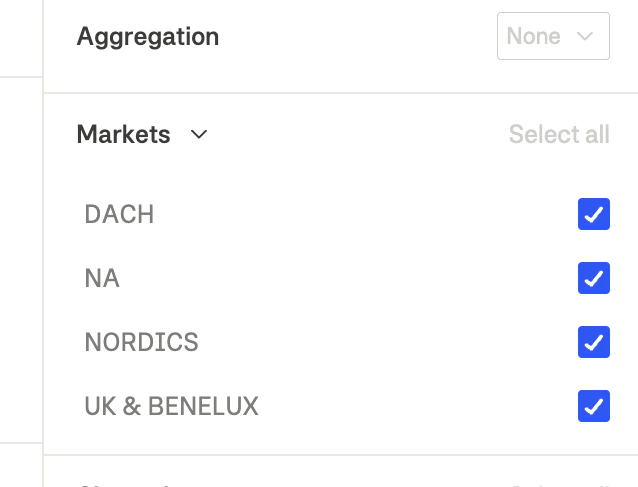
Markets filter
The markets filter lets you focus on specific geographic regions.
How to use
- Open the View tab in the right sidebar
- Find the Markets section
- Check or uncheck markets to include/exclude them from the view
- Click Select all to show all markets
Available markets
Markets are defined during your MMM onboarding and typically include:
- Geographic regions (e.g., DACH, NORDICS, NA, UK & BENELUX)
- Country-level breakdowns (e.g., US, UK, DE, SE)
When you filter markets, all metrics, charts, and recommendations update to show only the selected markets.
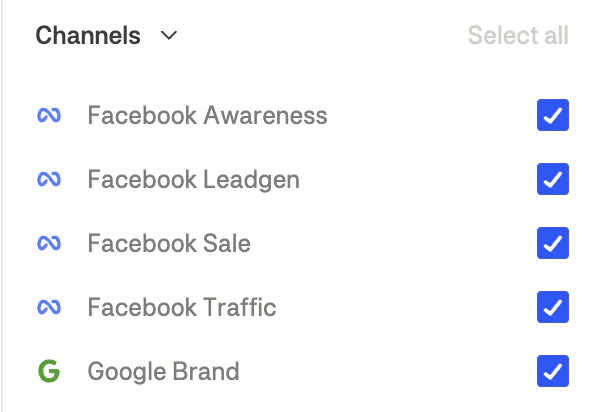
Channels filter
The channels filter lets you focus on specific marketing channels or funnels.
How to use
- Open the View tab in the right sidebar
- Find the Channels section
- Check or uncheck channels to include/exclude them from the view
- Click Select all to show all channels
Metrics filter
The metrics filter controls which metrics are visible in tables and charts.
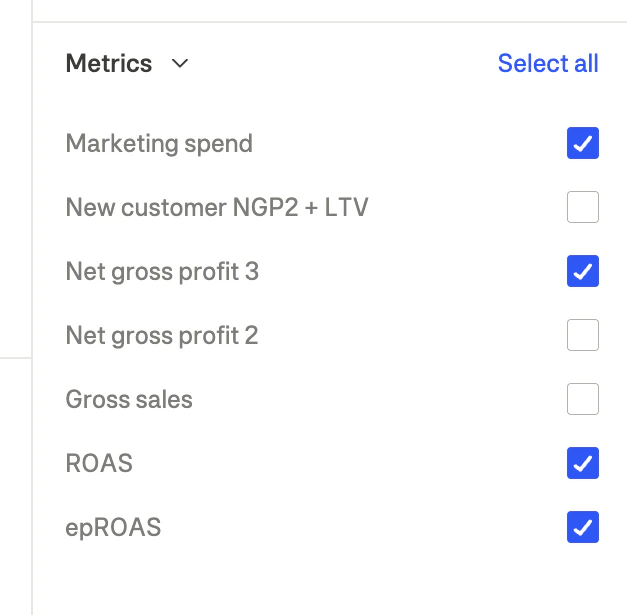
Available metrics
| Metric | Description |
|---|
| Marketing spend | Total marketing spend amount |
| New customer NGP2 + LTV | New customer value with lifetime value |
| Net gross profit 3 | NGP2 minus marketing spend |
| Net gross profit 2 | Gross sales minus returns, COGS, and fulfillment costs |
| Gross sales | Total revenue |
| ROAS | Return on ad spend |
| epROAS | Effective profit ROAS |
How to use
- Open the View tab in the right sidebar
- Find the Metrics section
- Check or uncheck metrics to show/hide them
- Click Select all to show all metrics
Date range selection
The date range picker in the header controls the time period for analysis.
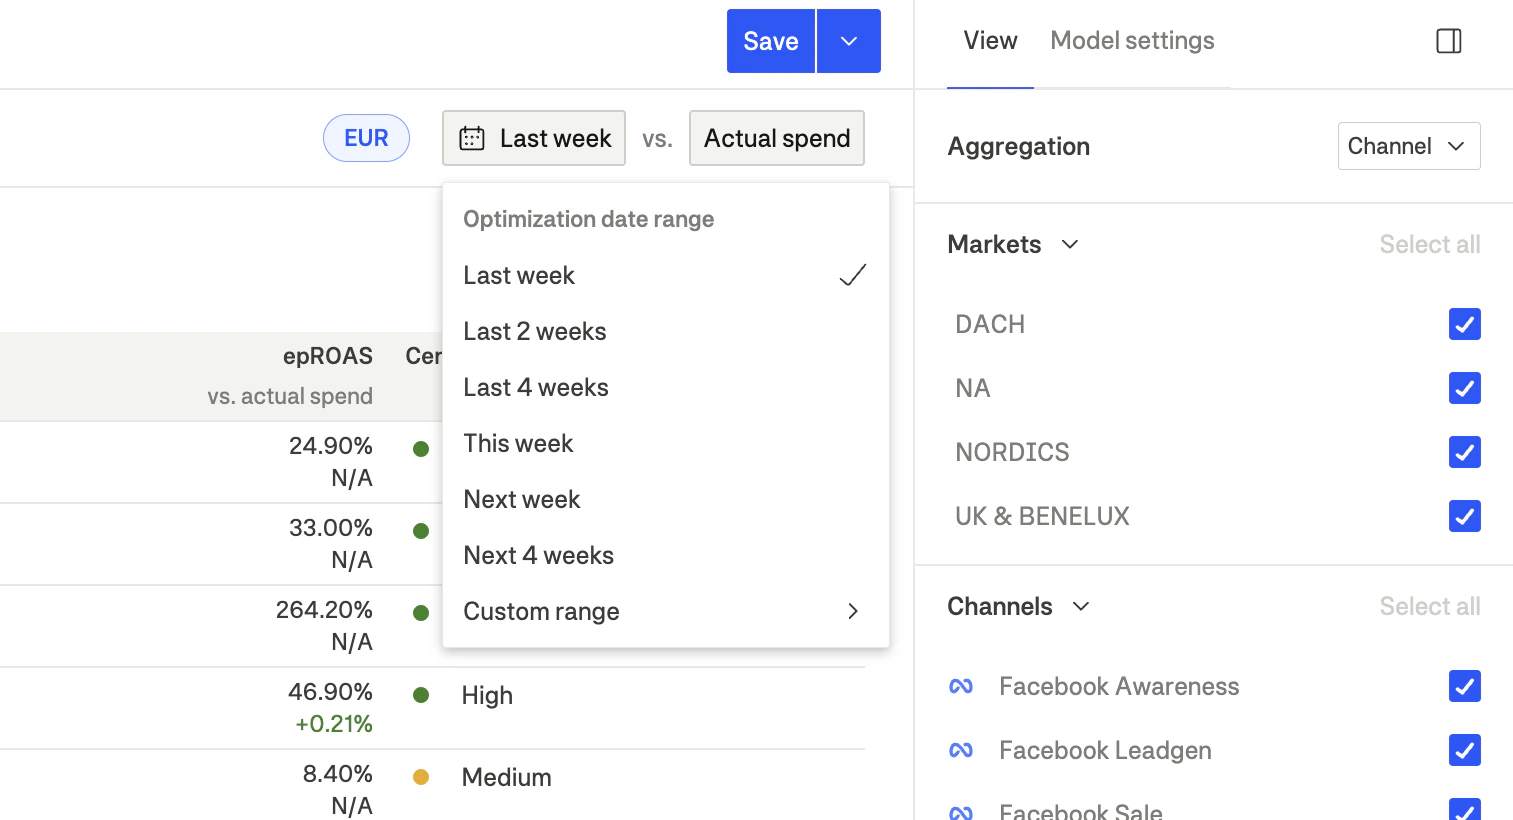 MMM operates on aggregated weekly data, with weeks starting on Monday. You can select complete previous weeks for historical reporting, or future weeks to plan upcoming budget allocations.
For historical analysis, select past weeks to see what optimal allocation would have achieved compared to your actual spend. This helps you understand missed potential and validate model accuracy.
For future planning, select upcoming weeks to get forecasted recommendations based on predicted seasonality and trends. You can also select a custom date range if you need a specific period—just ensure you’re selecting complete weeks for accurate analysis.
MMM operates on aggregated weekly data, with weeks starting on Monday. You can select complete previous weeks for historical reporting, or future weeks to plan upcoming budget allocations.
For historical analysis, select past weeks to see what optimal allocation would have achieved compared to your actual spend. This helps you understand missed potential and validate model accuracy.
For future planning, select upcoming weeks to get forecasted recommendations based on predicted seasonality and trends. You can also select a custom date range if you need a specific period—just ensure you’re selecting complete weeks for accurate analysis.
Saving view preferences
View settings are saved as part of your MMM configuration. Adjust filters and aggregation to your preferred view, then click Save in the header. Your view preferences will be restored when you return.