How Dema approaches MMM
Dema’s Marketing Mix Modeling (MMM) is designed to help you optimize your marketing investments by focusing on profitability rather than just sales. The model supports multiple optimization targets and empowers you to allocate your budgets more effectively by identifying where further spending yields diminishing (and potentially unprofitable) returns.
Key Idea: Traditional MMM tools often optimize for sales or ROAS. Dema’s model goes a step further by identifying where additional spend isn’t profitable, making it easier to maximize profit instead of just revenue.
Optimization targets
Dema’s MMM supports four different optimization objectives, allowing you to align the model with your business goals:
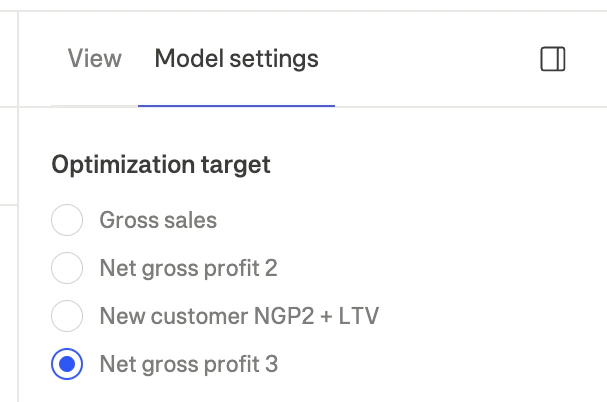
| Target | Description |
|---|
| Gross sales | Optimize for total revenue without accounting for costs |
| Net gross profit 2 (NGP2) | Optimize for gross sales minus returns, COGS, and fulfillment costs |
| Net gross profit 3 (NGP3) | Optimize for NGP2 minus marketing spend |
| New customer NGP2 + LTV | Optimize for new customer acquisition value plus their predicted lifetime value |
Funnel-based modeling for accuracy
During onboarding, you’ll define funnels that reflect your marketing strategy. These funnels let you group campaigns by their purpose or goal. For example:
- Lower funnel: Meta campaigns containing “lower” in their name.
- Upper funnel: Google Display or awareness-focused campaigns.
Using funnels ensures the MMM model accurately reflects how you manage your marketing channels. Dema’s modeling draws on these funnel groupings to capture the unique contribution of each channel to profitability.
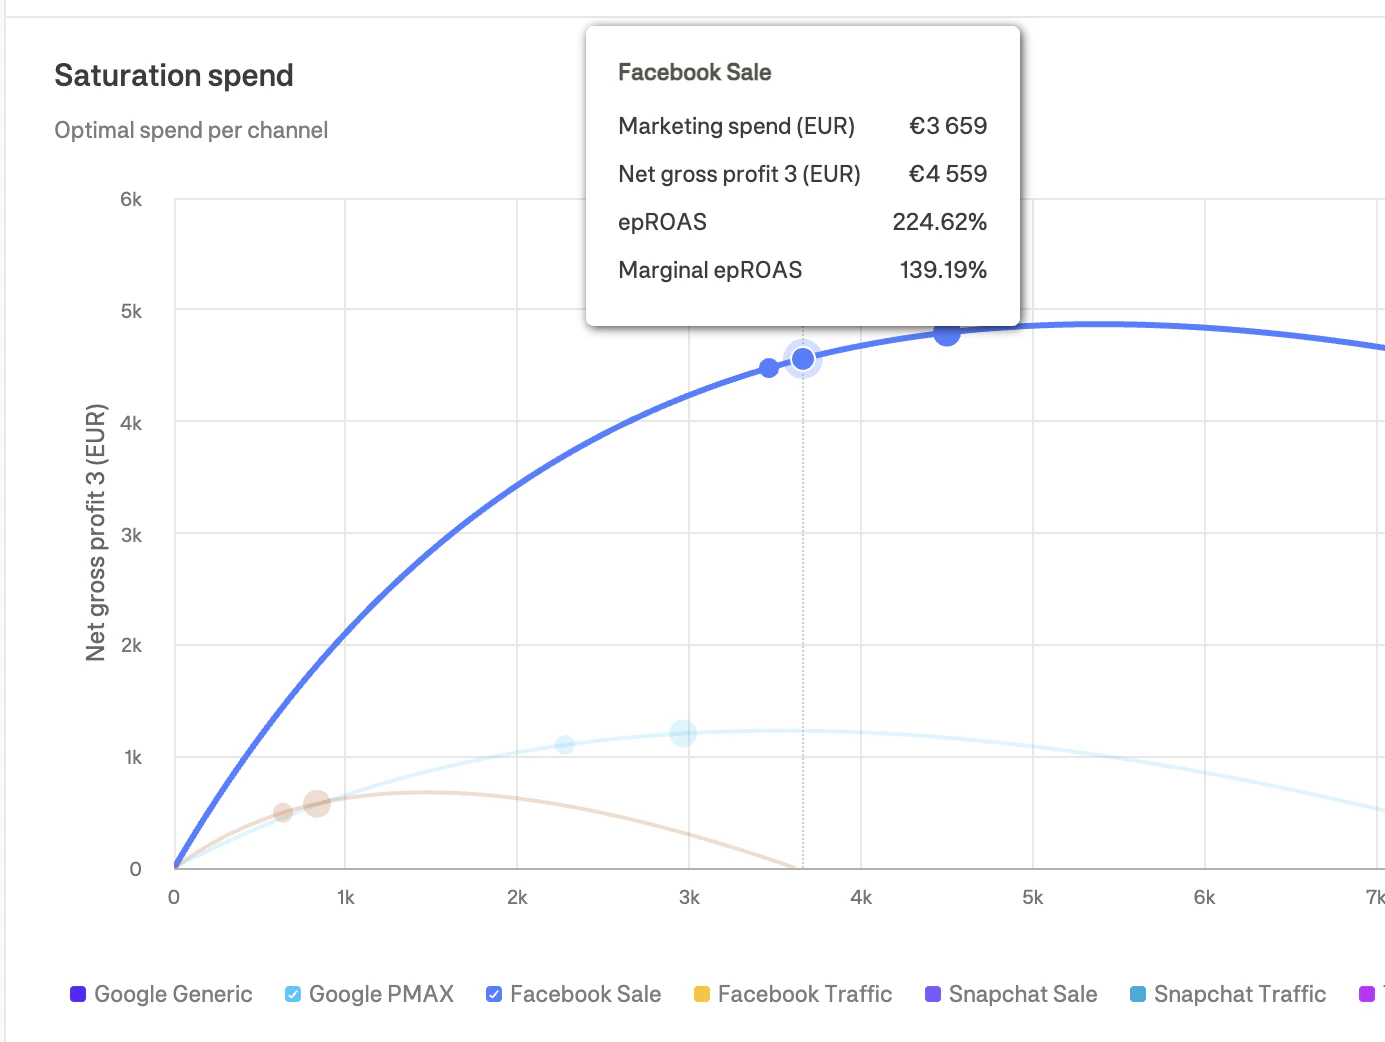
Profit-first modeling
Dema’s MMM centers on saturation curves (also known as profitability curves):
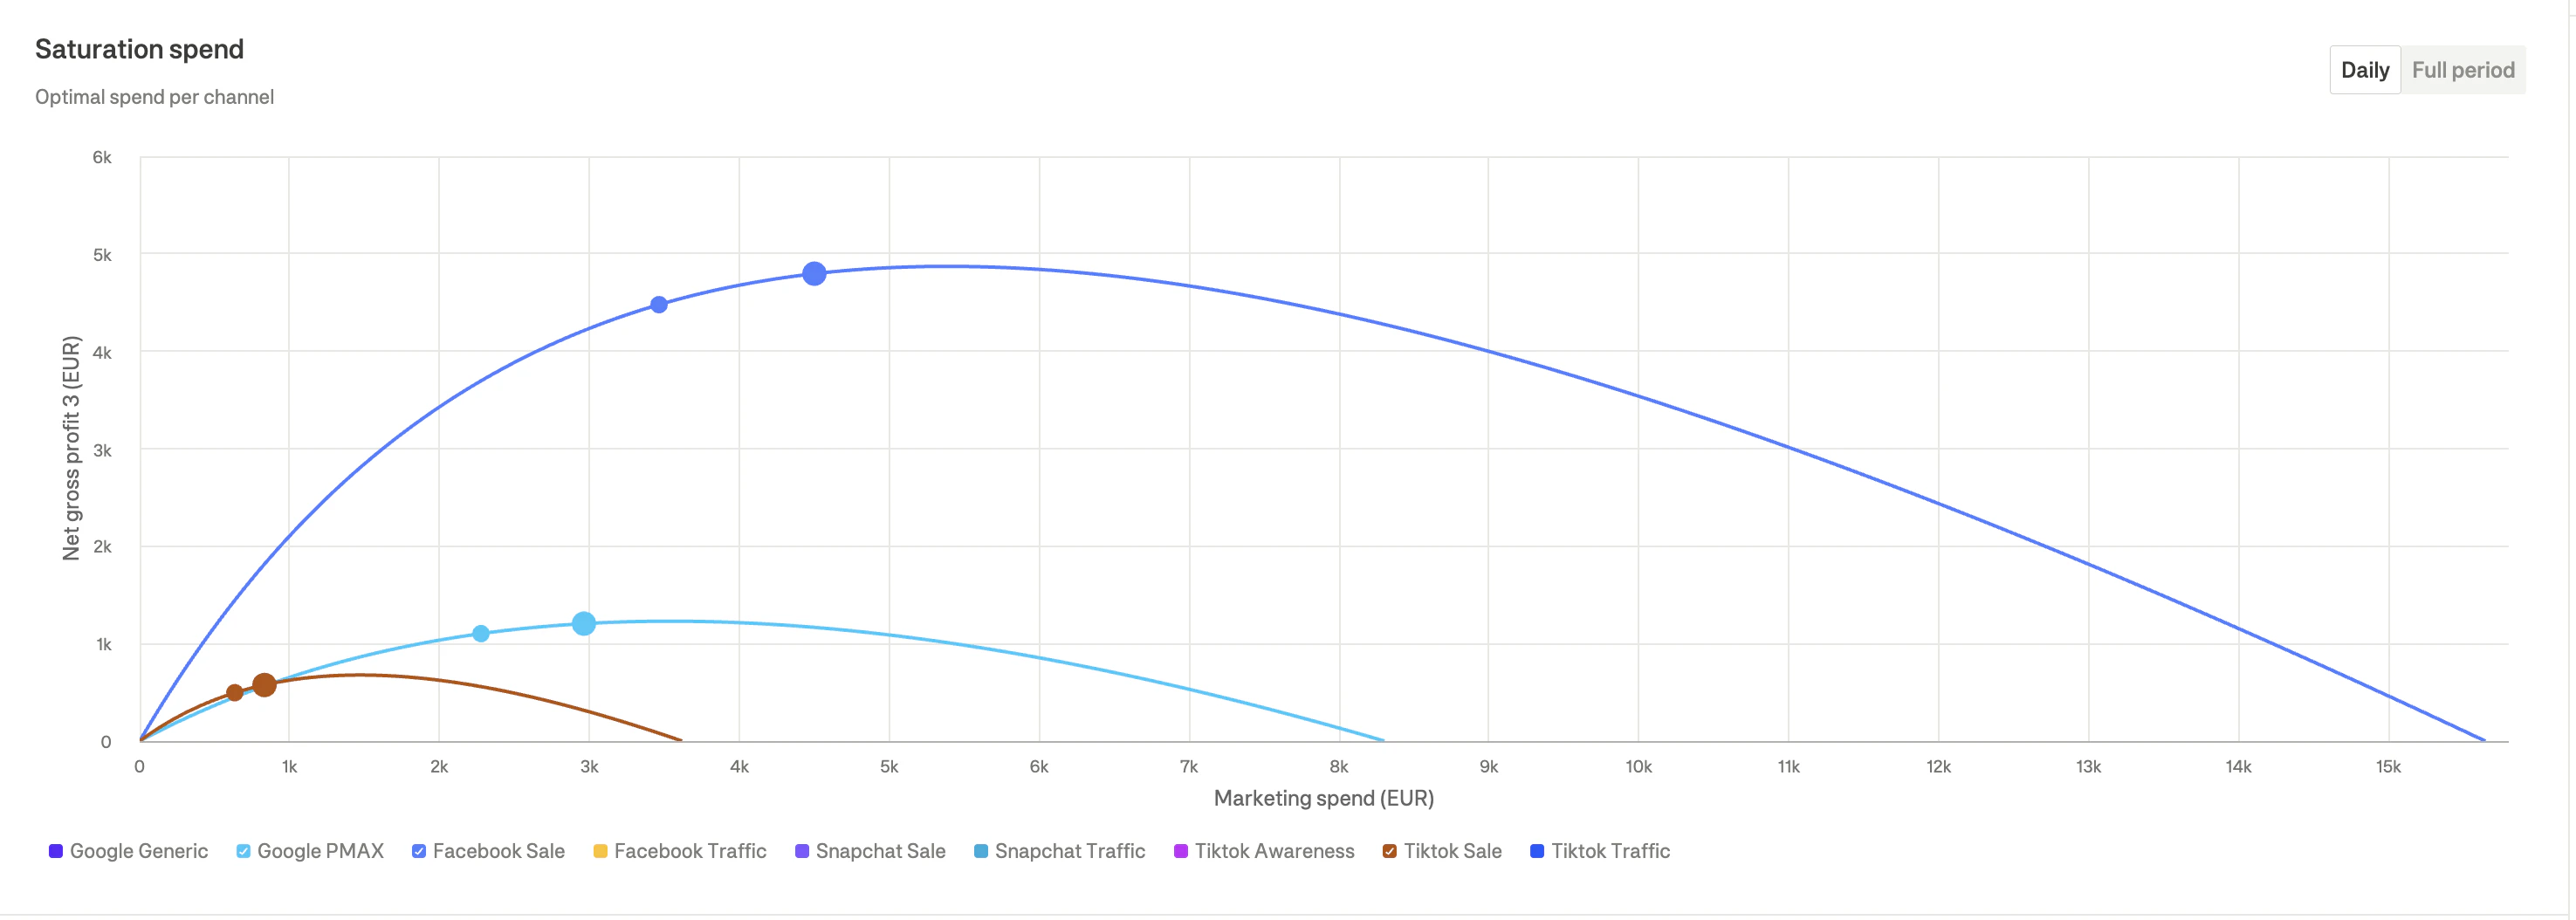
- Diminishing returns: Each channel’s impact on profit decreases as you spend more, represented by curves where returns eventually plateau or become negative.
- Profitability threshold: Dema pinpoints the moment where an additional dollar of spend no longer generates positive profit. By focusing on profit rather than sales, you can avoid overspending in pursuit of revenue alone.
This approach helps you discover exactly where your marketing budget delivers the best possible profit impact—not just top-line sales.
Adstock modeling
Marketing effects don’t happen instantly—they accumulate over time. Dema’s MMM includes adstock modeling to capture this delayed impact:
- Cumulative effect: When you spend on advertising, the impact builds up over subsequent days and weeks before reaching its full effect.
- Decay rate: The effect gradually diminishes over time as brand awareness fades and customers complete their purchase journey.
Understanding adstock curves
The Cumulative adstock effect chart shows how quickly each channel reaches its full impact:
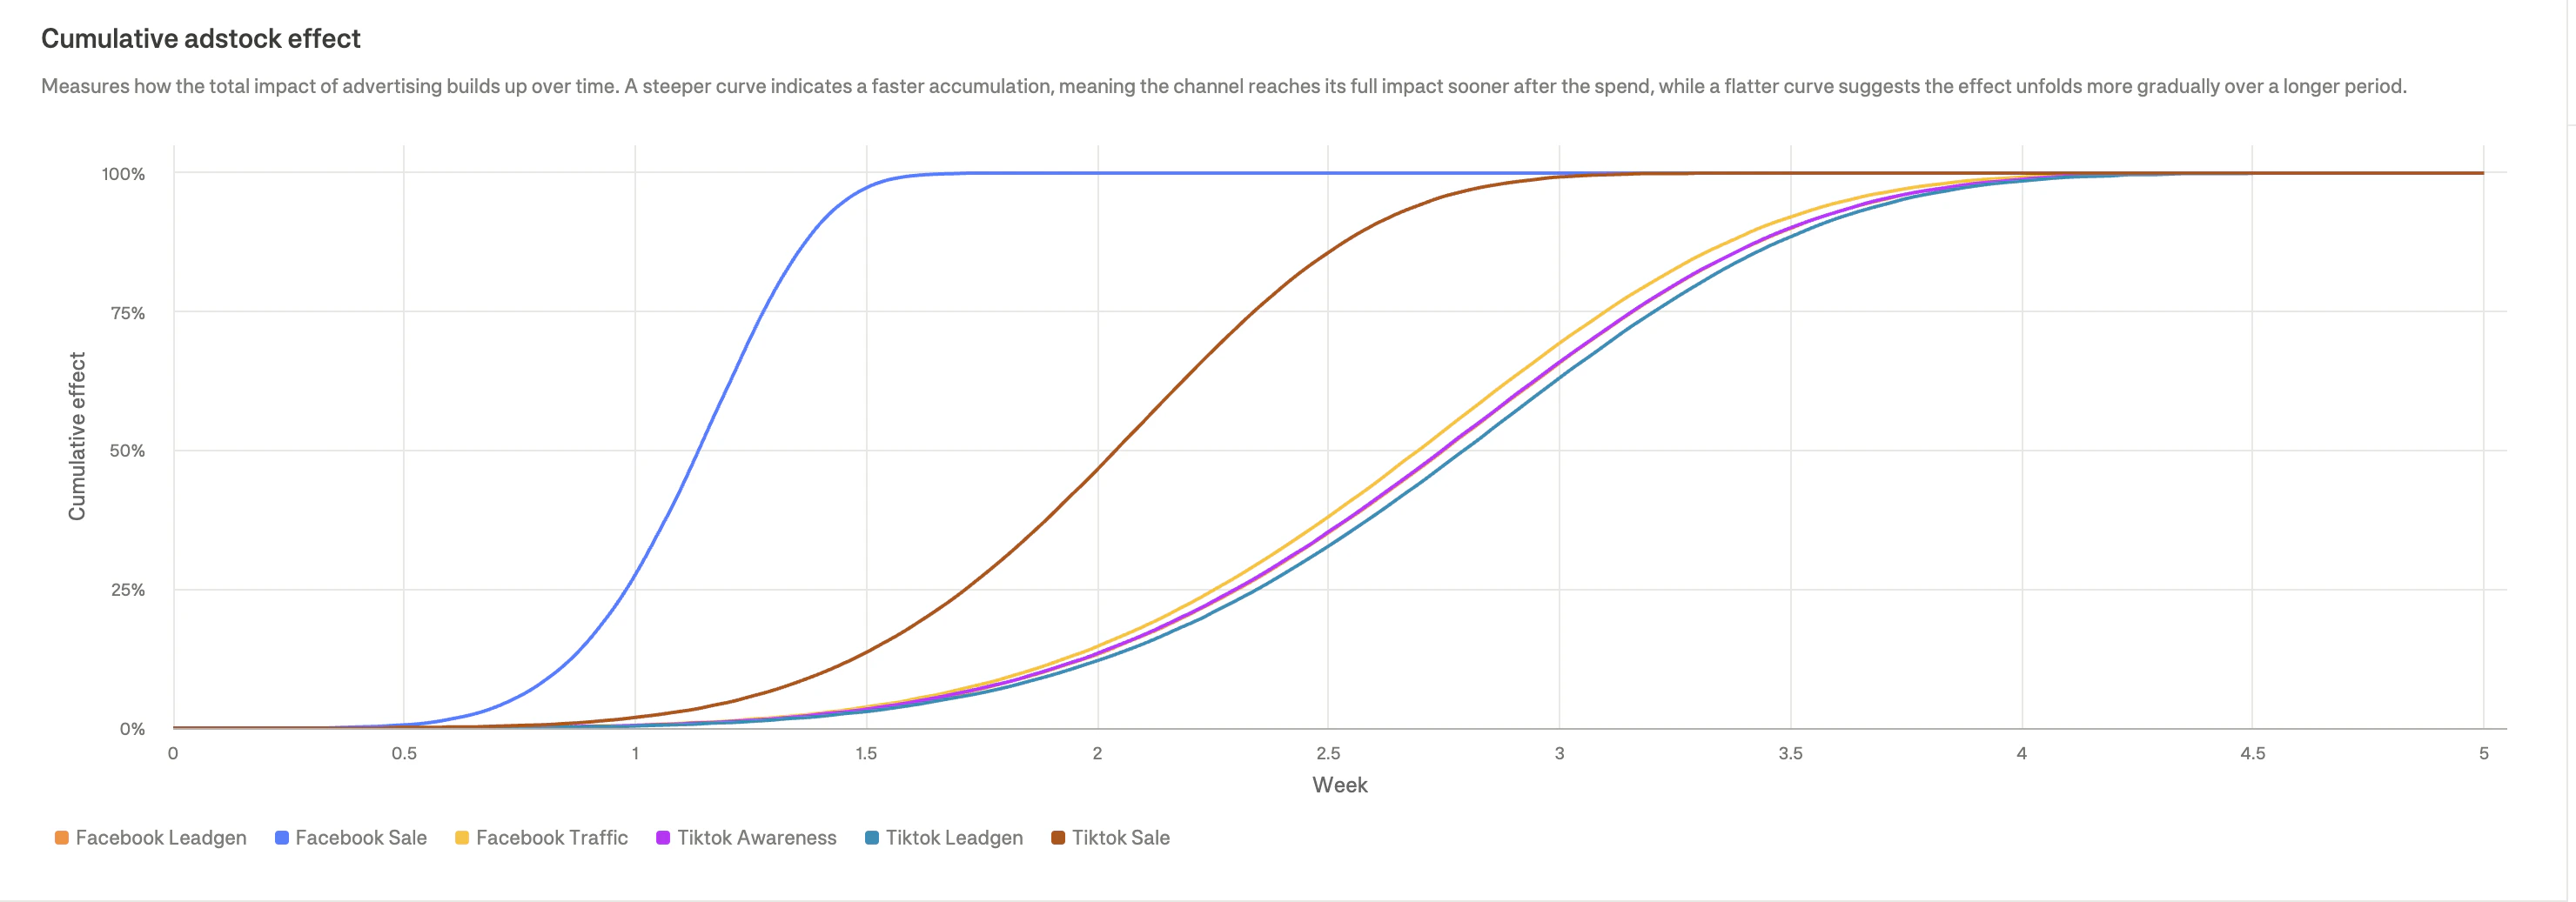
- Steeper curves: Indicate faster accumulation—the channel reaches its full impact sooner after the spend.
- Flatter curves: Suggest the effect unfolds more gradually over a longer period.
This is particularly important for awareness channels (like display or video) which often have longer adstock periods compared to performance channels (like search).
Channels with longer adstock periods may appear less effective in short-term analysis but can drive significant value over time. Consider this when evaluating upper-funnel investments.
Model calibration
Dema’s MMM can be calibrated with incrementality experiments to improve accuracy and reliability.
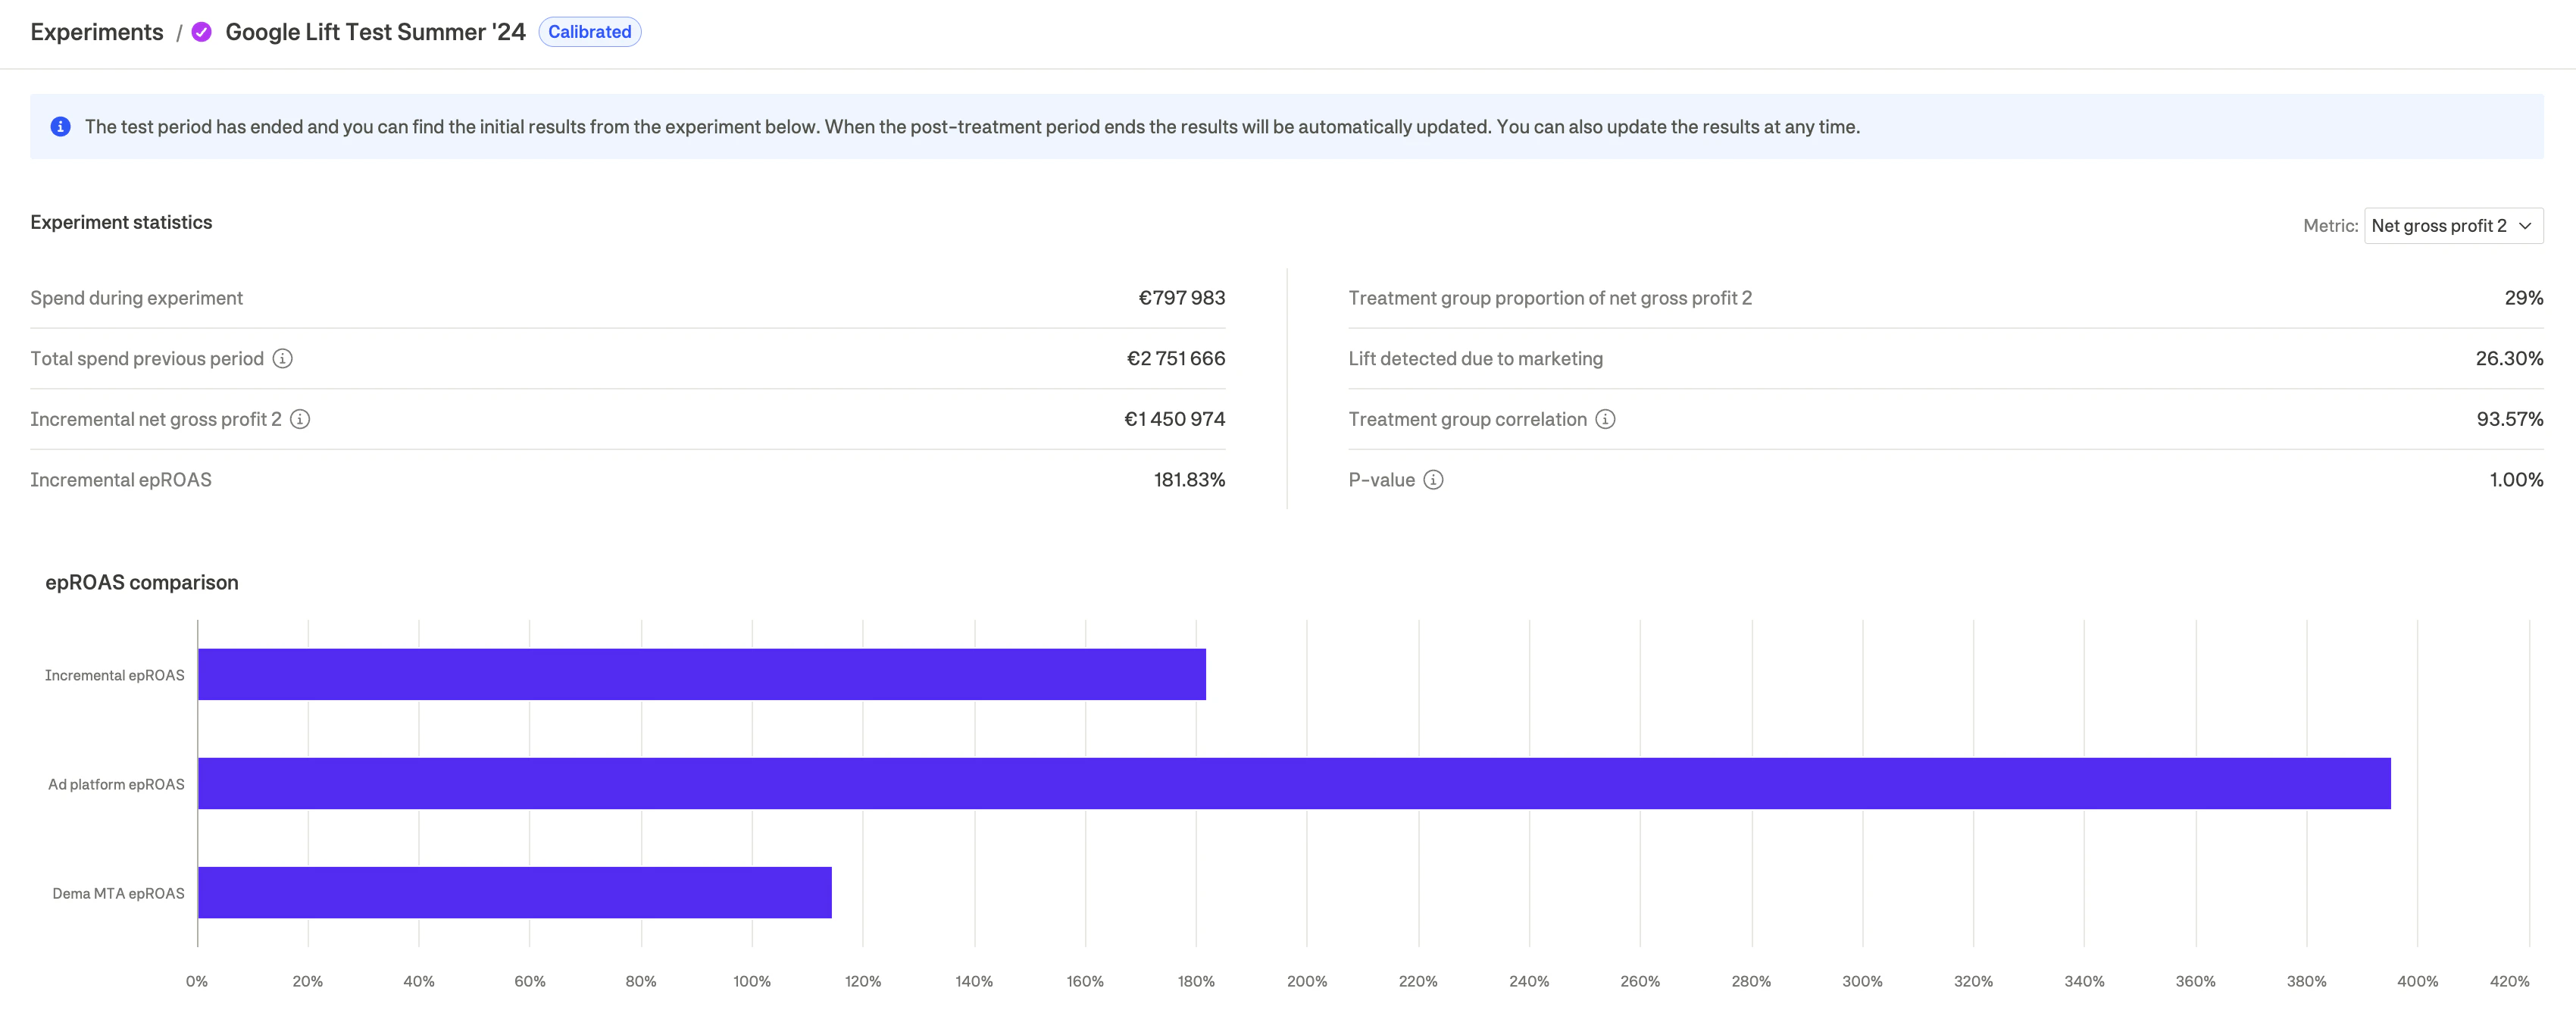 When you run incrementality tests, the results are fed back into the MMM to calibrate channel effectiveness. This provides ground-truth measurements that improve model accuracy.
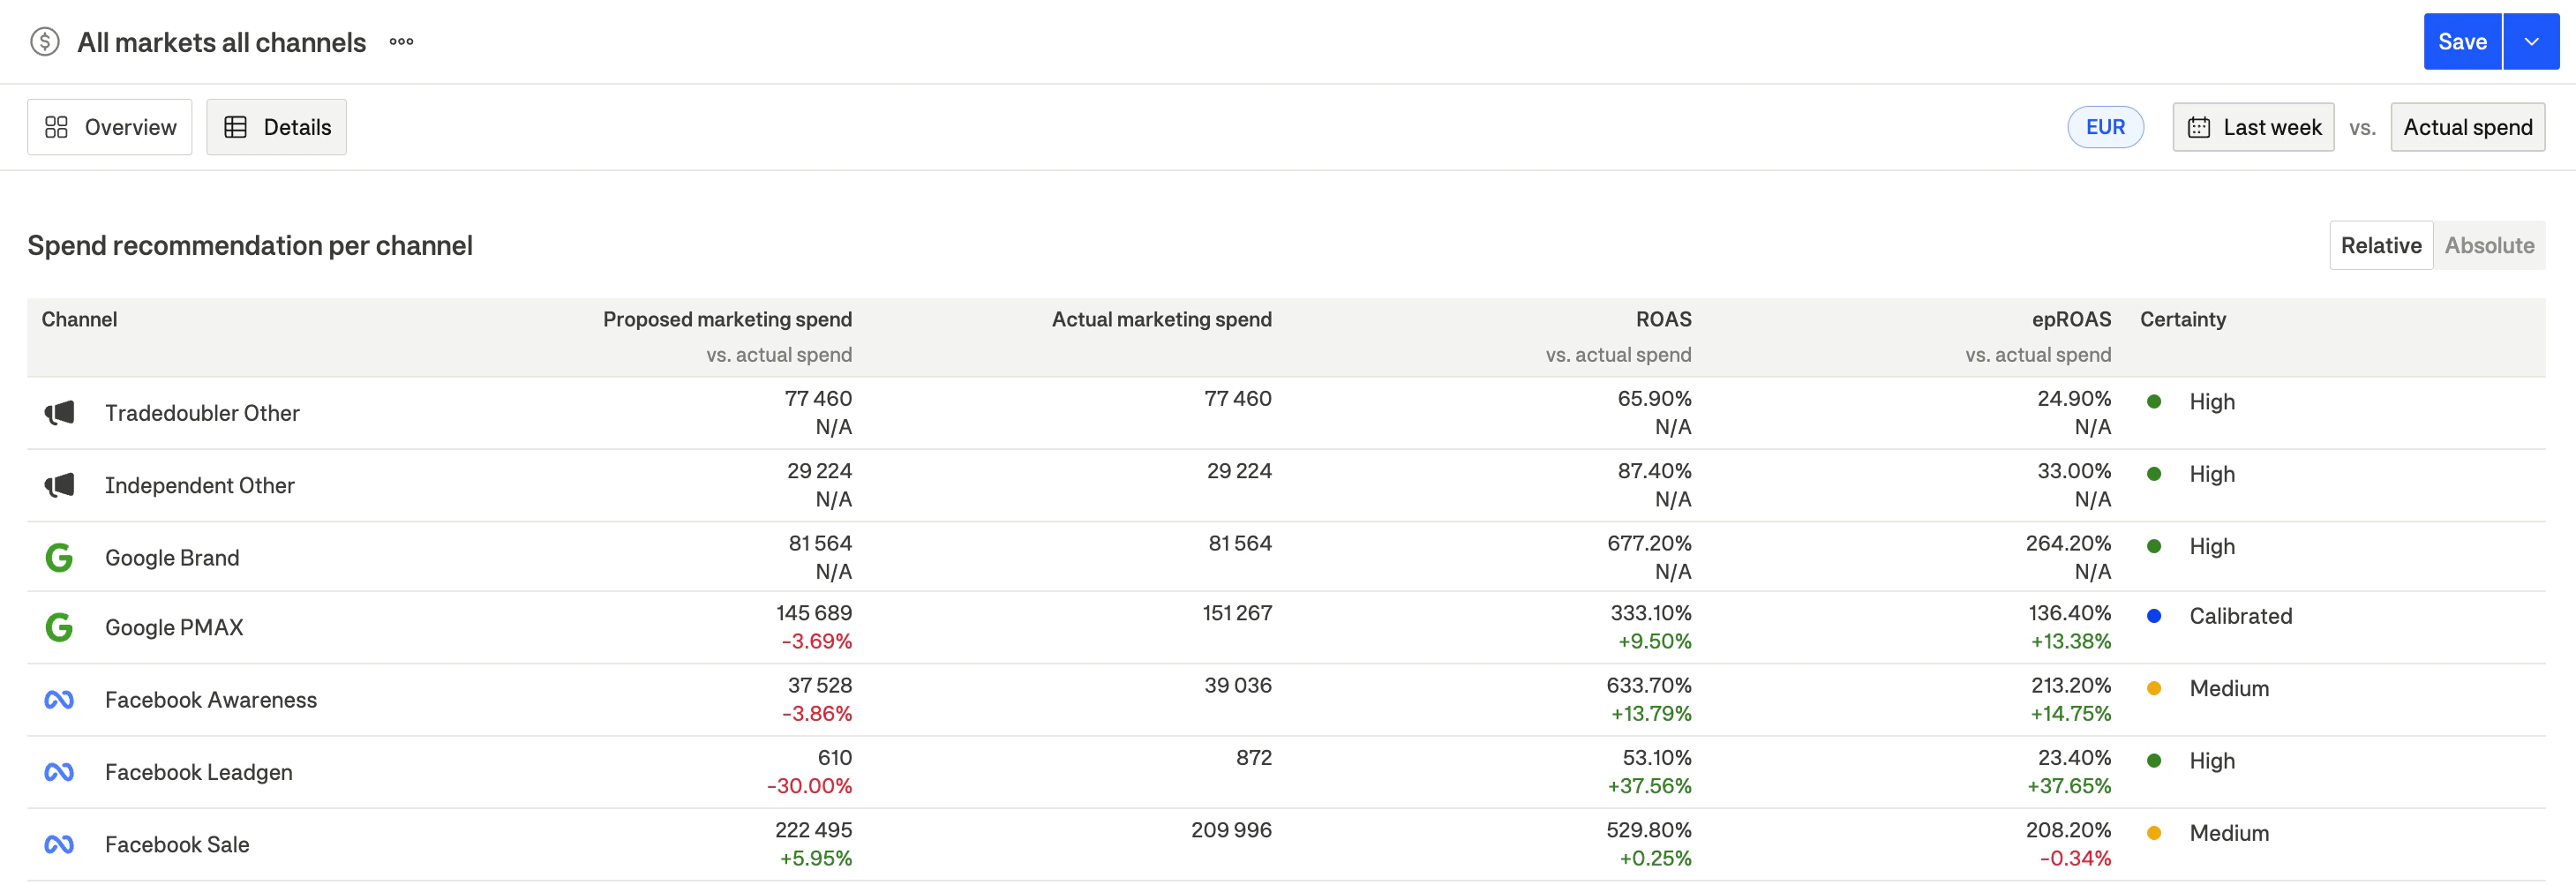
Certainty indicators
Based on calibration data, each channel receives a certainty indicator:
| Indicator | Meaning |
|---|
| High (green) | High model confidence—consistent historical data and/or successful calibration |
| Medium (orange) | Moderate confidence—limited data or some uncertainty in estimates |
| Calibrated (blue) | Channel has been calibrated with incrementality experiment data |
| Run test (red) | Insufficient confidence—recommend running an incrementality test |
Channels marked with “Run test” are good candidates for incrementality testing. Running an experiment will provide calibration data and improve model confidence.
How the modeling works
-
Data ingestion
- Dema taps into your historical spend, traffic, conversions, and profit data (including marketing costs), all of which is already cleaned and enriched within the platform.
- Minimum one year of data is required to capture seasonality and establish a robust baseline.
- Relevant control variables (e.g., holidays, discounts, inventory levels) are also integrated.
-
Time-varying baseline
- Dema accounts for factors like organic traffic and brand strength to build a baseline model for both sales and profit.
- Seasonality and brand growth are automatically included.
-
Funnel-based modeling
- Your predefined funnels guide the model in grouping campaign activities.
- Dema uses advanced statistical approaches (Bayesian methods) to create separate models per market, updated weekly.
-
Adstock and saturation transformations
- Marketing spend is transformed using adstock (carryover effects) and saturation (diminishing returns) functions.
- These transformations capture real-world marketing dynamics.
-
Calibration integration
- Incrementality experiment results are incorporated as priors to improve accuracy.
- The model continuously learns from new calibration data.
-
Control variables
- Events like Black Friday, product launches, or discount periods can be included.
- For additional control variables not automatically tracked (e.g., offline activities), you can provide this data to Dema’s MMM specialists for integration.
Control variables: These are custom events or factors that influence your performance (e.g., holiday periods or special discounts). Dema’s MMM specialists can help you set them up for improved accuracy.
Model validation & diagnostic checks
Dema uses hold-out validation and goodness-of-fit measures to ensure each MMM is reliable and accurate:
- Hold-Out Validation: Part of your historical data is withheld from the training process. The model’s performance is then measured against this “unseen” data.
- Goodness-of-Fit Metrics: Indicators like R-squared or MAPE show how closely the model’s predictions align with actual performance.
Spotting Unusual Patterns
- Outliers: Large spend spikes or anomalies could indicate data errors or untracked events.
- Holiday Effects: Seasonal promotions or campaign overlaps may require additional control variables for clarity.
What makes Dema’s MMM different?
1. Multiple optimization targets
Choose from four different objectives (Gross sales, NGP2, NGP3, New customer NGP2 + LTV) to align recommendations with your business strategy.
2. Experiment-calibrated
Incrementality experiment results are integrated directly into the model, providing ground-truth calibration that improves accuracy.
3. Weekly insights
Dema’s MMM runs every week, delivering fresh insights for each market and funnel group. This granularity makes it easier to course-correct and respond to shifting market conditions in near-real time.
4. Real-world constraints
- Guardrails: By default, Dema caps weekly spend adjustments at ±30% to avoid disrupting ad algorithms (e.g., Meta, Google).
- Channel-specific limits: You can configure spend limits or minimum budgets at a channel level, ensuring alignment with your strategic goals.
- Budget constraints: Set minimum return targets to ensure profitability thresholds are met.
Key outputs from MMM
Optimal spend per channel
Based on the model’s saturation curves, you’ll see recommended spend levels that maximize profit (rather than just revenue). This includes respecting the guardrail limits by default.
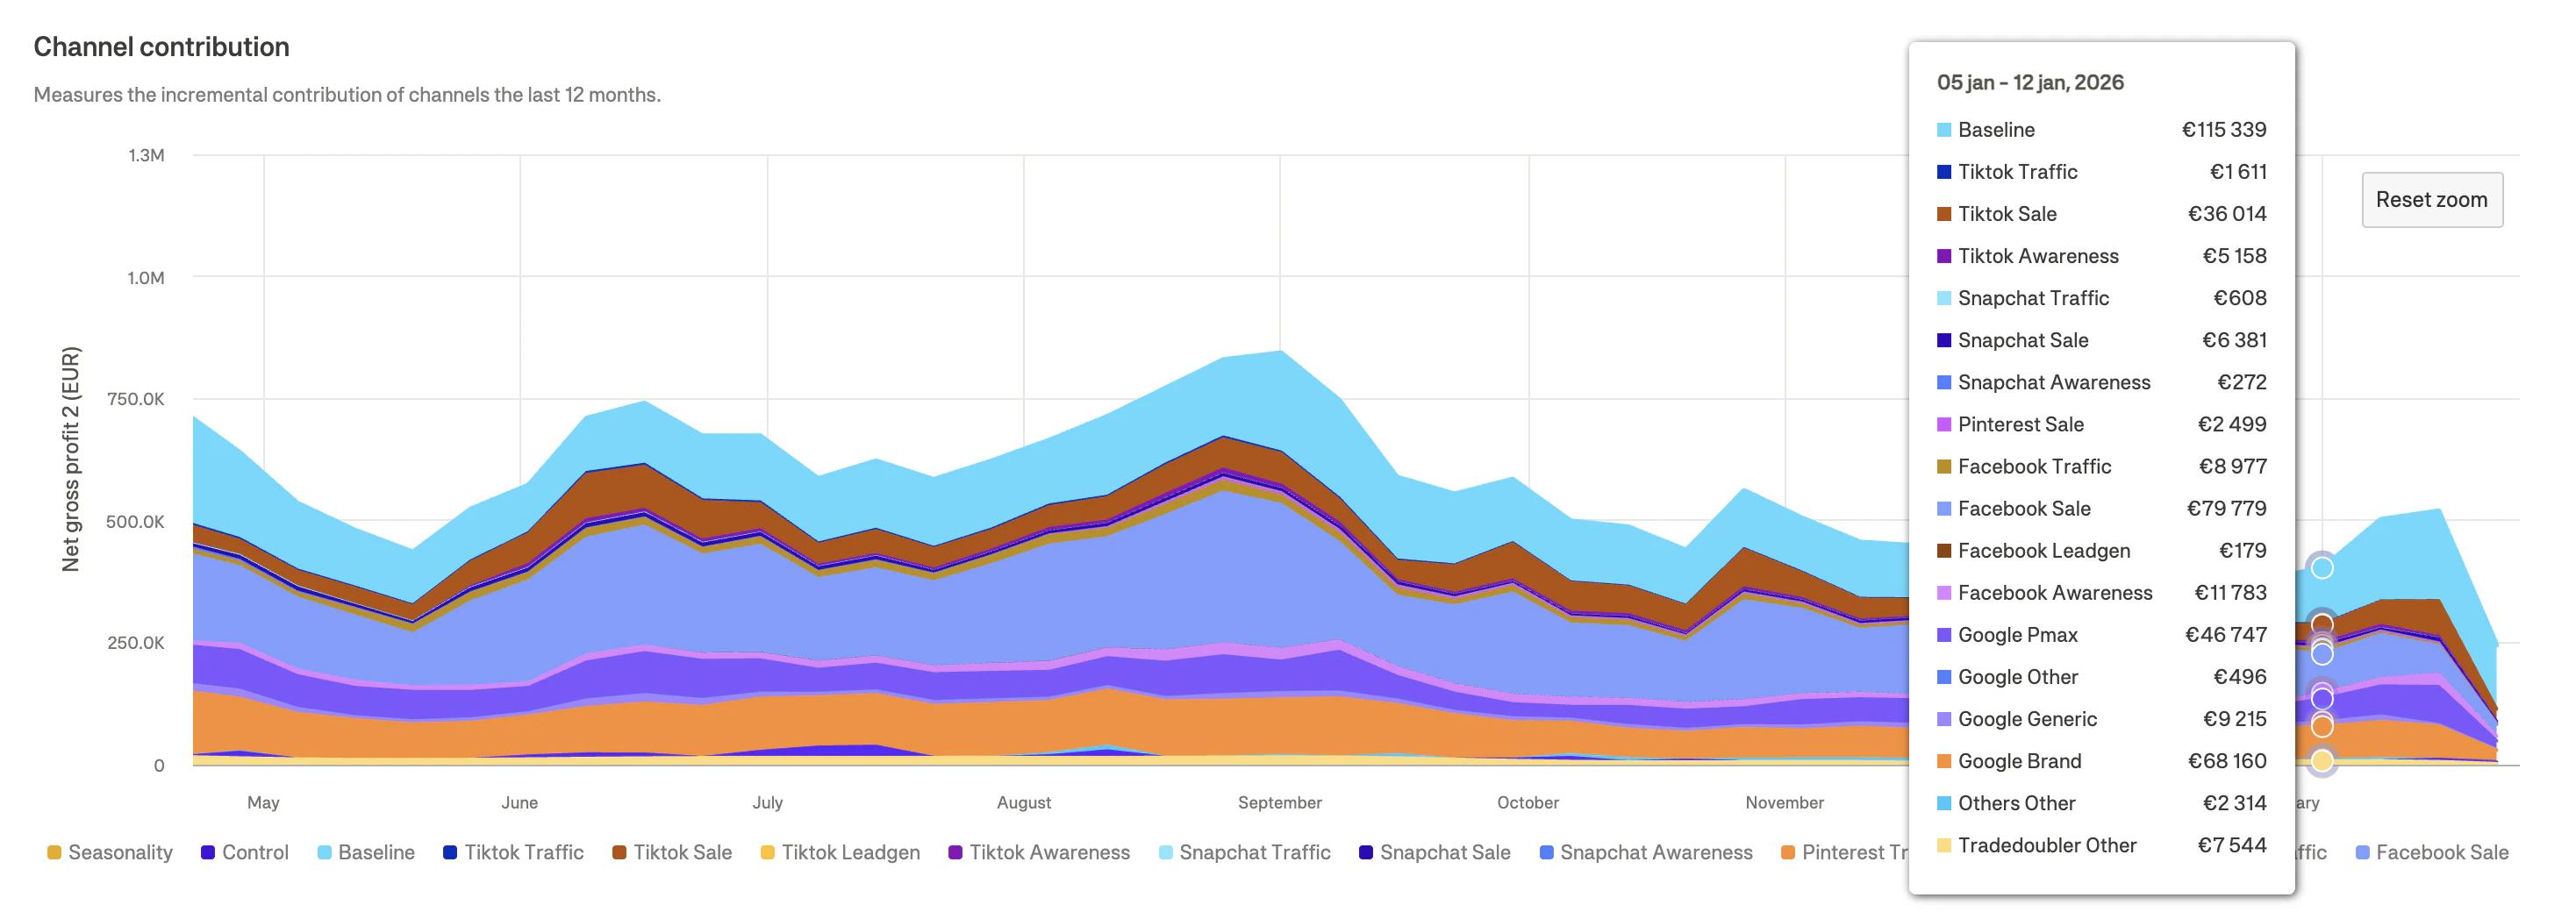
Channel contribution
Dema quantifies each channel’s contribution to performance, breaking down:
- Marketing contribution: Direct impact from paid channels
- Baseline contribution: Organic and brand-driven performance
- Seasonal contribution: Time-based patterns (holidays, seasonality)
- Control contribution: Impact from custom events and variables
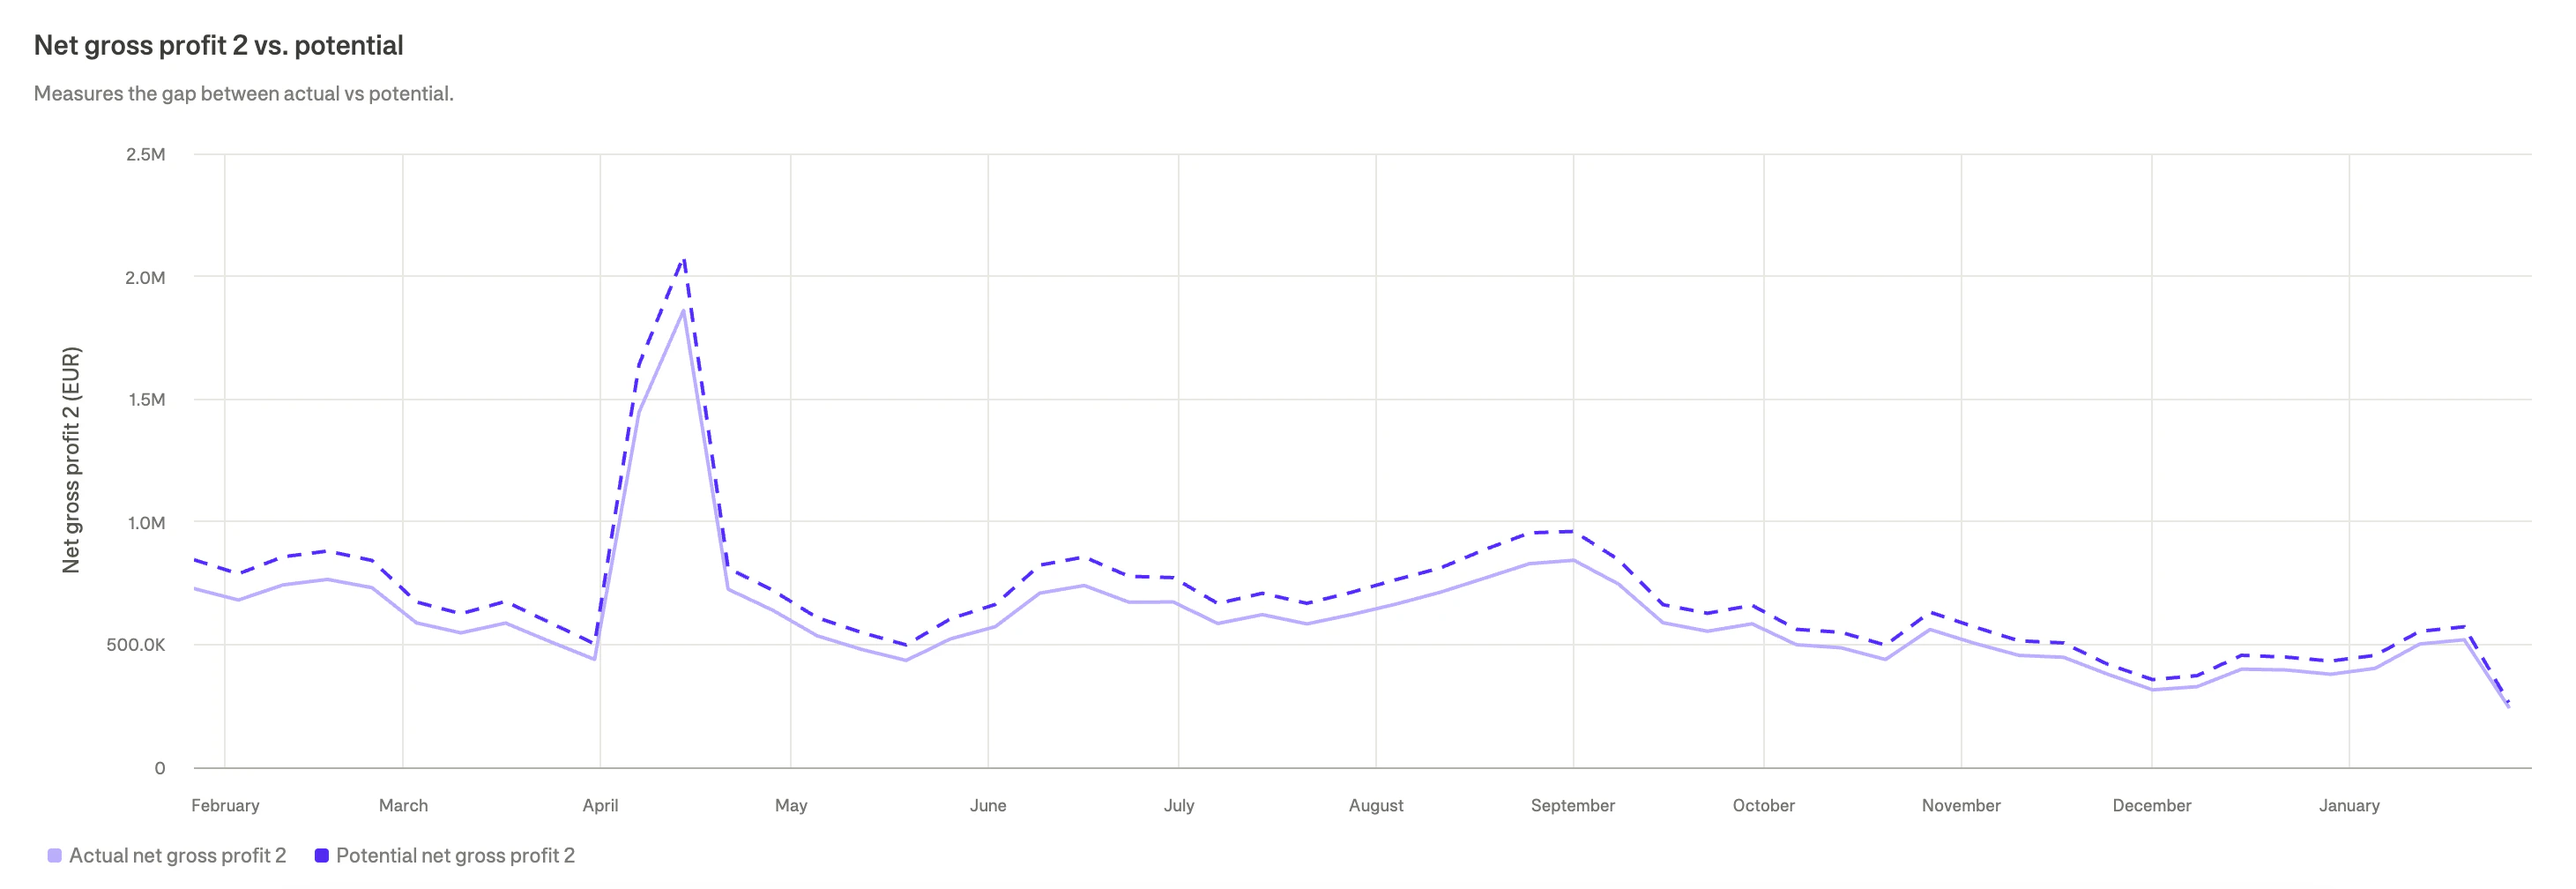
Profit potential
The model calculates potential profit gains—showing you the value of reallocating spend. By highlighting missed profit, Dema helps quantify what’s at stake if budgets aren’t optimized.
Return metrics
The model calculates return metrics based on your selected optimization target, showing both the absolute return and the marginal return (incremental value of additional spend).
Implementation tips
Adjusting real-world budgets to match Dema’s recommended spend can be both an art and a science. Here are some best practices:
-
Gradual budget changes
- By default, Dema suggests a ±30% maximum weekly adjustment, but if that still feels too aggressive, consider smaller increments (e.g., ±10–15%) and monitor performance metrics closely.
- Use the guardrails settings to customize limits per channel.
-
Syncing with ad platforms
- Google Ads: Align Dema’s recommended ROAS target with your campaign settings (e.g., Target ROAS bidding). For daily budgets, break down the weekly recommendation accordingly.
- Meta: If optimizing by CPA or conversion goals, adjust bids or budget caps gradually to avoid shocks to the algorithm.
-
Track early signals
- Keep an eye on early KPIs (e.g., CPC, CTR) after making changes. If you spot unusual spikes or dips, consult Dema’s model to verify whether the shift matches your new budget strategy.
-
Ongoing monitoring
- Dema’s weekly MMM updates make it easy to course-correct quickly. Regularly review performance and consider adjusting constraints if a channel consistently overshoots or undershoots profit targets.
-
Run incrementality tests
- For channels with “Run test” certainty indicators, consider running an incrementality experiment to gather calibration data and improve model confidence.
Handling channels with very small spend
For channels that receive minimal spend and show little measurable impact:
-
Funnel consolidation
- Group multiple small channels with similar objectives into a single funnel to increase data volume and improve model accuracy.
-
Minimum spend constraints
- Force a small but consistent spend (e.g., 5–10% of the budget) so that the model can detect any incremental profit impact over time.
-
Incremental testing
- Run an incrementality experiment to measure true incrementality before scaling spend.
Have questions about funnels, control variables, or constraints? Dema’s MMM specialists can help you tailor the model to your unique business needs.