The Weekly analysis view lets you dive deeply into historical performance at a week-by-week (or multi-week) level. It’s here that you can see exactly which channels might have hit diminishing returns in the past and where you could have optimized spend for greater net gross profit.
Keep in mind that historical insights, while crucial, may not fully account for upcoming seasonality or future shifts in consumer behavior. For forward-looking optimization that incorporates future seasonality and changing market conditions, be sure to create a future scenario using Dema’s scenario-planning tool.
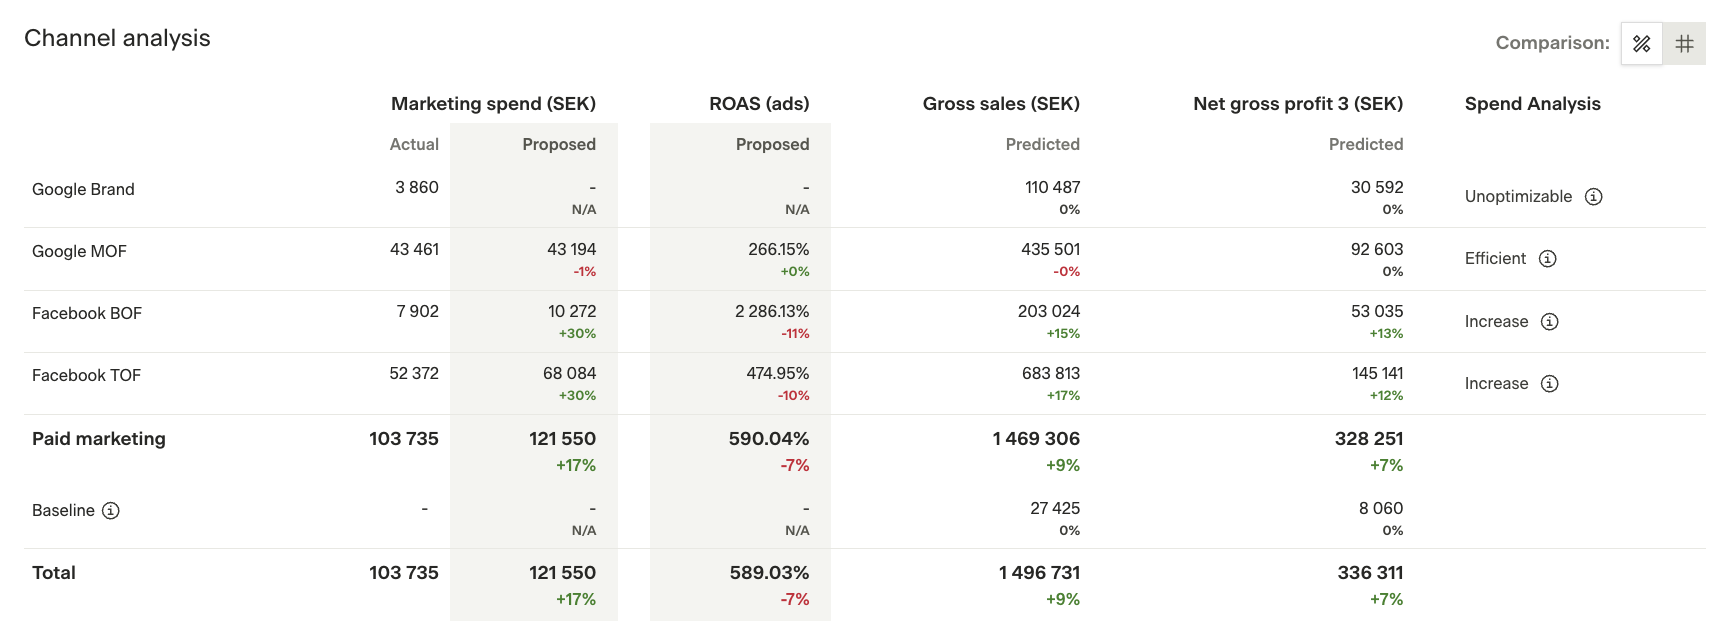
Below is an example of how Dema’s Weekly analysis table might look for a given (historical) week. Here’s how to read these results and decide on actions to maximize your net gross profit if the same conditions were to recur.
Understanding the columns
-
Marketing spend (Actual vs. Proposed)
-
Actual: What you truly spent during this (past) period.
-
Proposed: What Dema recommends you should have spent to optimize profit. A green +XX% indicates an increase in spend, while a negative (e.g., –1%) suggests a slight decrease.
-
ROAS (ads)
-
Shows the ROAS target you should set in ad platforms (e.g., as a ROAS target in Google Ads) given the Proposed budget.
-
A red –XX% next to ROAS doesn’t necessarily mean the channel becomes unprofitable; it can mean the ROAS is slightly lower than before (due to diminishing returns) yet still yields higher overall profit.
-
Gross sales (Predicted)
-
How much revenue the model predicts for each channel if you had followed the proposed spending recommendations during that week.
-
A green +XX% indicates the model expects higher sales than you actually achieved in that past period.
-
Net gross profit 3 (Predicted)
-
The bottom-line profit figure after key costs like cost of goods sold and shipping.
-
This metric often carries the most weight, as it shows how effectively each channel could have driven profitable sales.
-
Spend analysis
-
Increase: The model indicates that additional budget likely would have generated profitable conversions.
-
Wasteful: The model indicates that a lower budget likely would have led to more profit overall.
-
Efficient: The channel is at or near the optimal spend level. Continuing a similar budget should maintain a healthy balance of returns.
-
Unoptimizable: The channel doesn’t have a measurable contribution curve (e.g., branded search). You’ll still see profit data, but the model won’t provide specific spending recommendations.
Analyzing the diminishing returns curve
In addition to the table, Dema’s Weekly analysis often provides a curve visualization for each channel, illustrating how changes in spend would have affected your net gross profit 3 (vertical axis). You’ll see up to three key data points:
-
Actual spend (gray dot)
- Represents what you actually spent during that historical period. The corresponding height on the curve shows your actual net gross profit 3.
-
Proposed spend (purple dot)
-
This is how much Dema suggests you should have spent, within any weekly constraints (e.g., ±30% from your last spend).
-
The model projects a higher net gross profit 3 at this point on the curve—indicating that increasing (or decreasing) your spend to this level would have driven more profit during that past timeframe.
-
Saturation spend (blue dot)
-
The unconstrained maximum on the curve—the theoretical peak net gross profit 3 if you disregarded the weekly spend limit (and other constraints).
-
The gap between the proposed spend and this saturation point reflects additional profit potential if you were to invest more heavily in that channel. However, large or abrupt increases may be risky or impractical depending on your budget, risk tolerance, or platform learning phases.
Tip: The higher the dot on the curve, the greater the predicted net gross profit 3 for that historical period. If you see a big gap between actual and proposed, it’s a strong sign you may have left profit on the table in that past timeframe.
Channel-by-channel curve examples
Below are three example curves from one week’s historical analysis, showing how different channels required different spend adjustments.
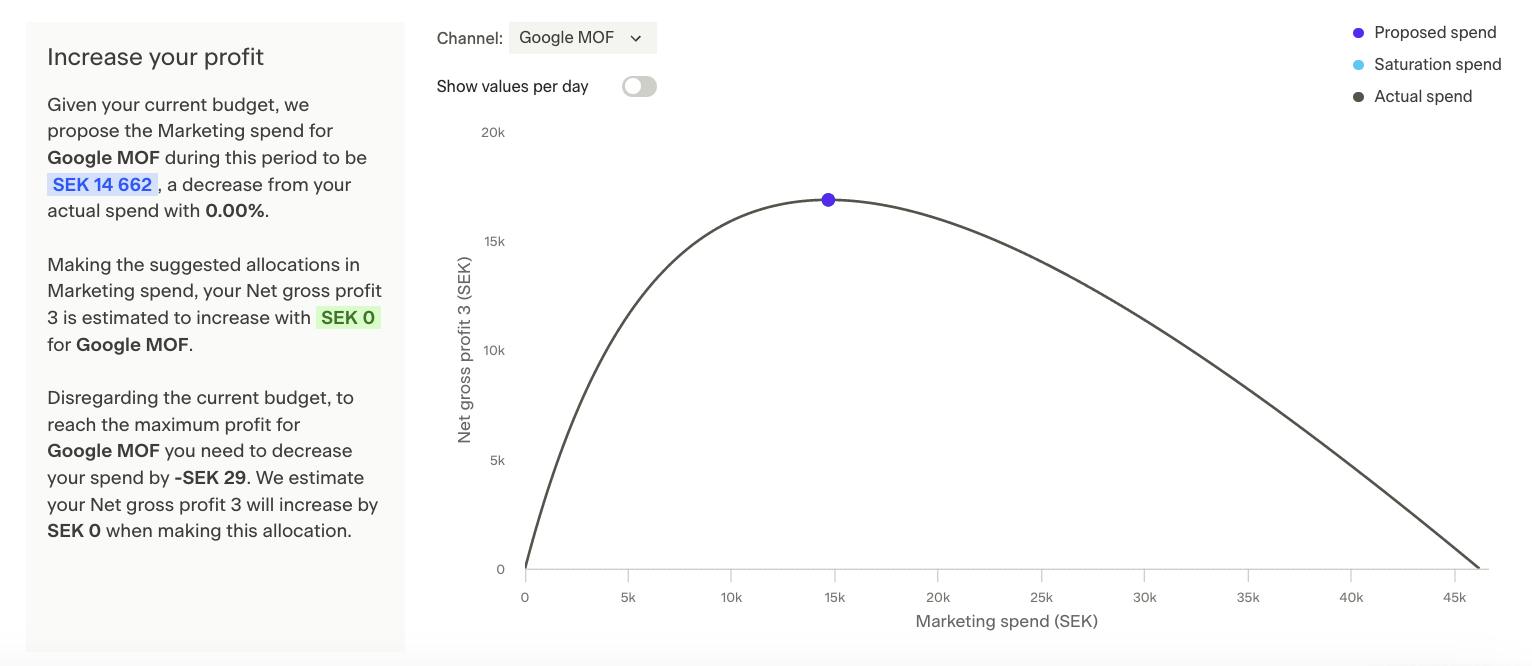
1. Google MOF
-
Actual vs. Proposed spend
-
Actual: ~14,691 SEK
-
Proposed: ~14,662 SEK (a 0% difference)
-
Indicates the channel was already at or very near its optimal spend level—no major change recommended for that week.
-
Net gross profit 3 impact
-
Dema’s model predicted 0 SEK additional profit by shifting budget.
-
The saturation point (blue dot) is close to the proposed dot, so there wasn’t much untapped profit potential.
-
Spend analysis
- Labeled Efficient in the table, meaning large shifts likely wouldn’t improve profitability under those past conditions.
Key takeaway: Google MOF was essentially “just right.” Minor tweaks might be considered if your broader marketing strategy changes, but no significant historical gain would have been expected by altering the spend.
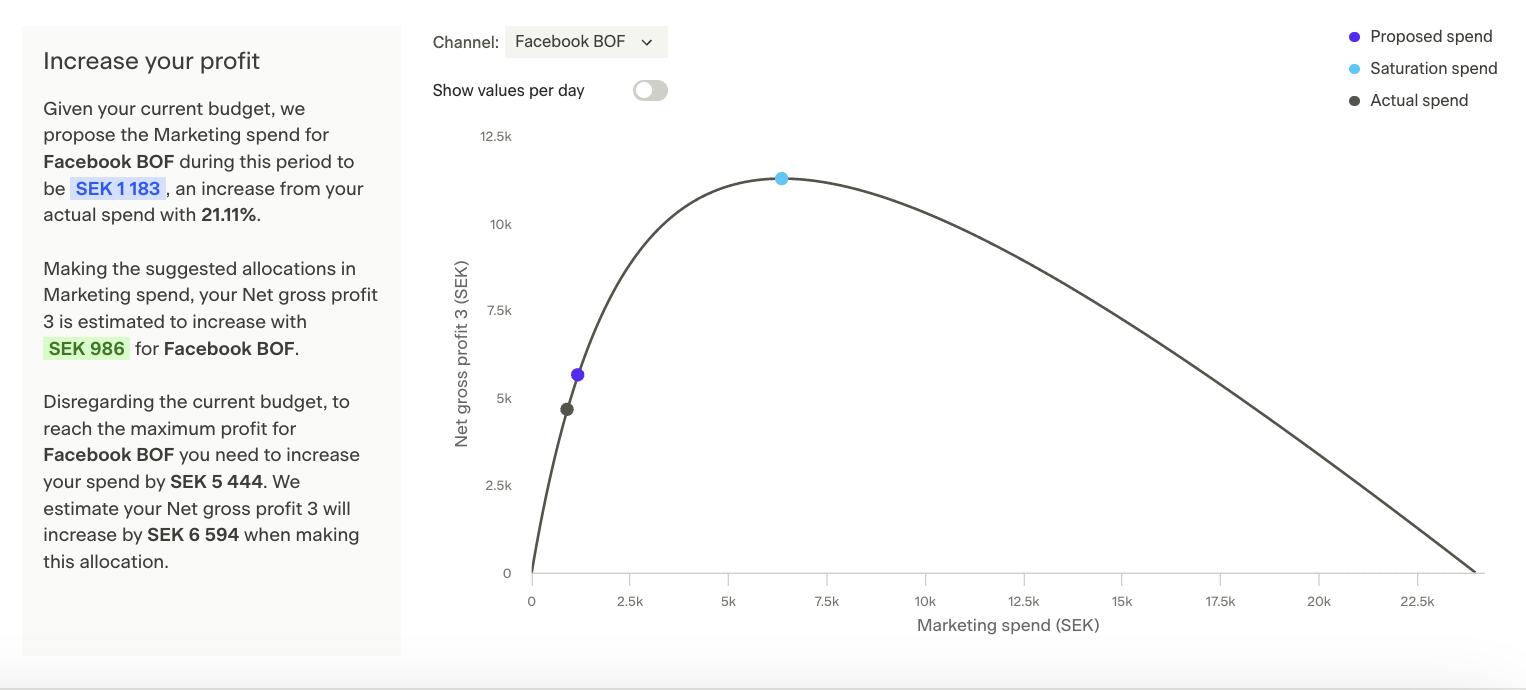
2. Facebook BOF
-
Actual vs. Proposed spend
-
Actual: ~910 SEK
-
Proposed: ~1,183 SEK (+21%)
-
The purple dot on the curve is higher than the gray dot, suggesting more budget could have yielded higher profit.
-
Potential profit gain
-
By boosting spend ~21%, the model predicted an additional 986 SEK in net gross profit 3.
-
If you ignored weekly constraints entirely, you could have invested up to ~5,444 SEK more (the blue dot), potentially adding 6,594 SEK in profit. However, that might have been too big a jump at once.
-
Spend analysis
-
Labeled Increase, indicating the channel had headroom before hitting diminishing returns.
-
A slower ramp-up (e.g., over multiple weeks) can help maintain stable campaign performance in real life and avoid platform disruptions.
Key takeaway: Facebook BOF was underspending historically. Increasing the budget—within the ±30% weekly cap—would likely have captured more conversions and grown overall profit.
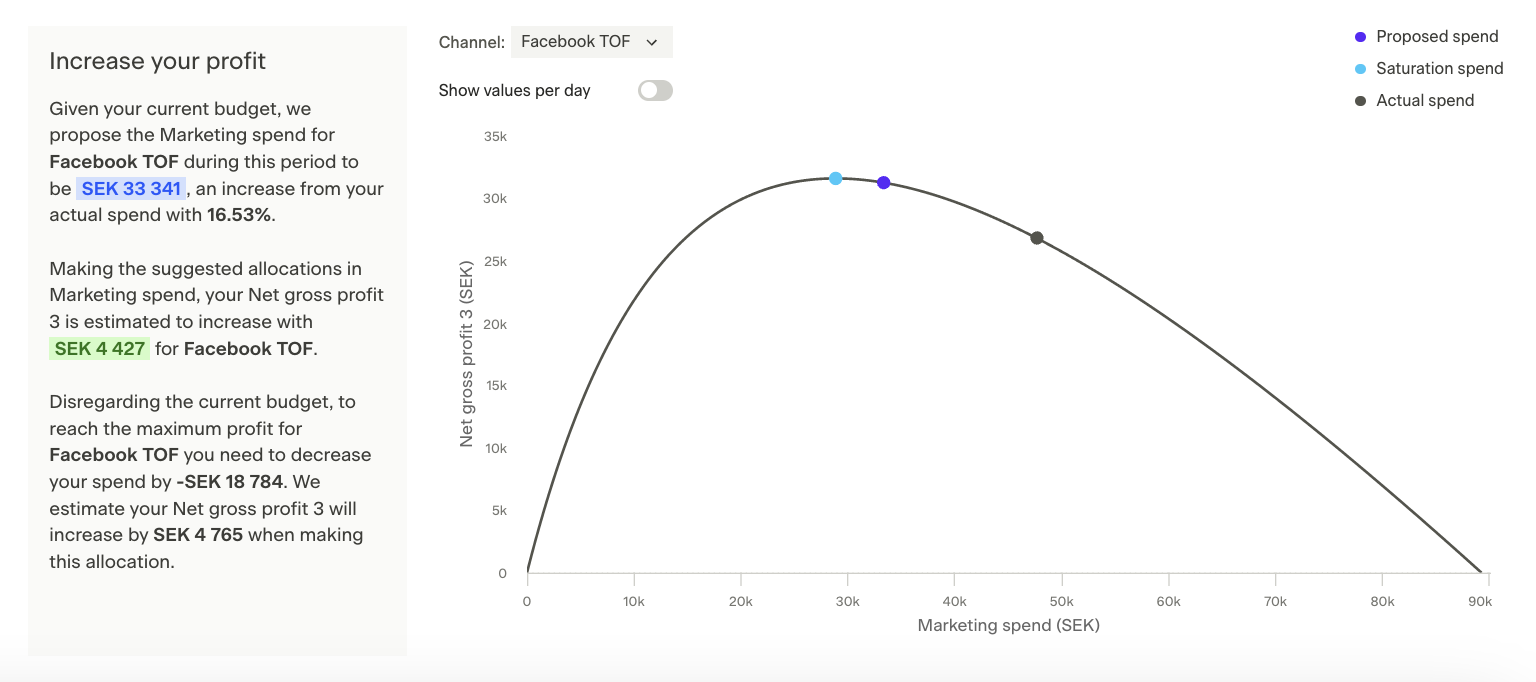
3. Facebook TOF
-
Actual vs. Proposed spend
-
Actual: ~47,630 SEK
-
Proposed: ~33,341 SEK (–30%)
-
The gray dot (actual) is to the right of the curve’s peak, indicating over-investment relative to profit returns in that past period.
-
Profit upside
-
Reducing spend to 33,341 SEK might increase net gross profit 3 by ~4,427 SEK over the actual scenario.
-
If you fully ignored constraints and aimed for the absolute saturation point, you’d cut even more spend—but dropping from ~47,630 SEK to the saturation level in one go could be disruptive.
-
Spend analysis
- Marked as Wasteful, meaning your historical budget exceeded the peak of profitability.
Key takeaway: Facebook TOF was overshooting. Cutting budget would likely have increased total profit by eliminating unproductive ad spend.
How to use it (for historical insights)
-
Compare actual to proposed
-
Spot channels where you could have raised or lowered spend to boost profit in the past.
-
A large positive or negative gap indicates a significant realignment in budget might have helped.
-
Check unoptimizable channels
- Some funnels (e.g., branded search) might not have a standard contribution curve. Dema still provides profit data, but no precise spending guidance.
-
Review constraints
-
By default, total weekly spend changes are capped at ±30%.
-
If the recommended shift was bigger than 30%, a phased approach might have been more practical.
-
Look for saturation opportunities
-
The blue “saturation” dot shows maximum profit potential in an unconstrained scenario for that past period.
-
In reality, you would scale up or down gradually to reach that potential.
-
Focus on net gross profit 3
-
Even if a channel’s predicted ROAS dipped, the total profit could have gone up if volume was high enough.
-
Prioritizing profit over simple ROAS metrics helps ensure you’re maximizing bottom-line returns.
Recommended actions (for future planning)
These historical insights can guide your forward-looking decisions:
-
Increase channels that had room to grow (e.g., Facebook BOF)
- Shift budget from other channels or your overall marketing pool in future weeks or months.
-
Maintain channels labeled Efficient (e.g., Google MOF)
- They’re at or near optimal historically—keep them stable unless market conditions shift.
-
Cut back where you were overspending (e.g., Facebook TOF)
- Even if it feels counterintuitive, reducing an unprofitable budget can raise your total profit.
-
Revisit weekly
- Dema’s MMM updates with fresh data, so keep fine-tuning your strategy as new results come in.
Looking ahead: future scenarios
While the Weekly analysis focuses on what could have happened given your past data and constraints, it doesn’t fully account for upcoming seasonality or new market conditions. That’s where Dema’s Future scenario tool comes in:
-
Future scenario considers predicted seasonal shifts and other forward-looking factors, helping you plan optimal budgets for the coming weeks or months.
-
Combining historical learnings with future scenario planning ensures you’re equipped to act on real-time insights and proactive forecasts.
Next steps
-
Implement changes: Update budgets on Google Ads, Meta, or other channels based on your historical insights—especially if you see similar market conditions now.
-
Monitor performance: Validate whether the model’s predictions align with real-world outcomes, focusing on net gross profit 3.
-
Create a future scenario: Use Dema’s scenario tool to incorporate seasonal shifts and future events, so you’re not just reacting to the past but proactively planning for what’s next.
By merging table insights and the diminishing returns curves for each channel in this historical context, you can refine your strategy for upcoming periods—allocating your marketing budget where it’s poised to generate the highest future profit.