> ## Documentation Index
> Fetch the complete documentation index at: https://docs.dema.ai/llms.txt
> Use this file to discover all available pages before exploring further.
# View settings
> Learn how to filter, aggregate, and customize the MMM view to focus on the markets, channels, and metrics that matter most.
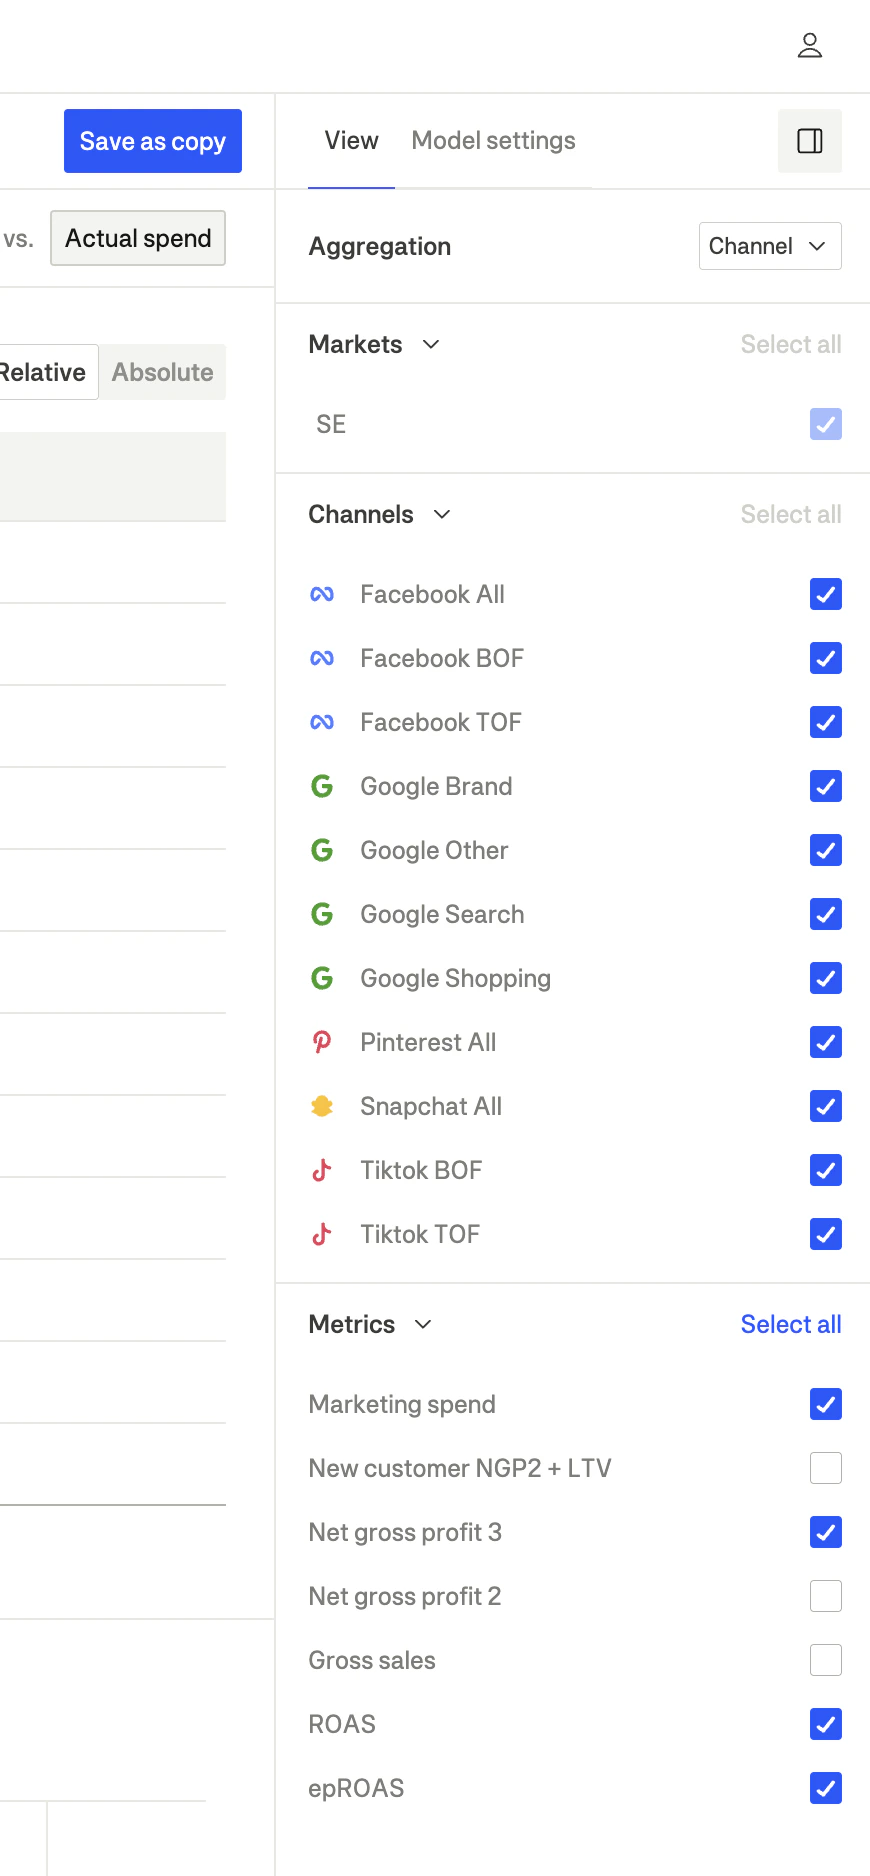
The **View** panel allows you to customize what data is displayed in the MMM interface. Access it by clicking the "View" tab in the right sidebar.
 ***
## Aggregation
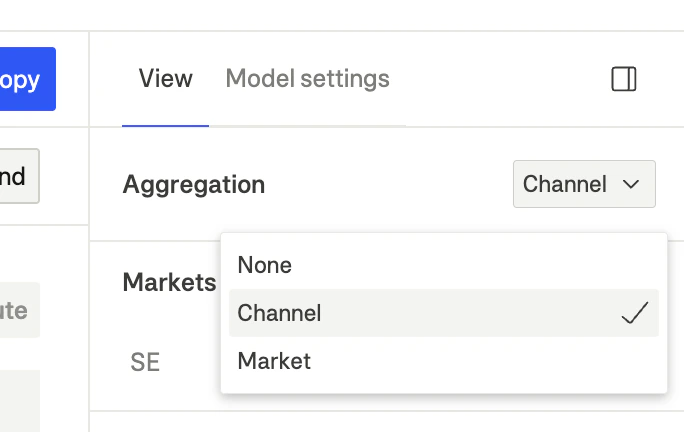
The aggregation setting controls how data is grouped in tables and charts. This is a powerful pivot feature that lets you analyze your data from different perspectives.
***
## Aggregation
The aggregation setting controls how data is grouped in tables and charts. This is a powerful pivot feature that lets you analyze your data from different perspectives.
 | Mode | Description | Use case |
| ----------- | ----------------------------------------------------------- | ------------------------------------------------------------ |
| **Channel** | Data is aggregated by marketing channel across all markets | Compare channel performance across your entire business |
| **Market** | Data is aggregated by geographic market across all channels | Identify which regions have the most optimization potential |
| **None** | Data is shown at the channel × market level (most granular) | Deep-dive analysis into specific channel-market combinations |
### How aggregation affects the view
When you change the aggregation setting:
* **Tables**: Rows will group by your selected dimension (channel or market)
* **Charts**: Visualizations will show data aggregated accordingly
* **Metrics**: Values are summed or averaged based on the aggregation level
Use **Channel** aggregation to compare channel performance across your entire business. Switch to **Market** aggregation to identify which geographic regions have the most optimization potential. Use **None** for the most detailed analysis when you need to see specific channel-market combinations.
***
## Markets filter
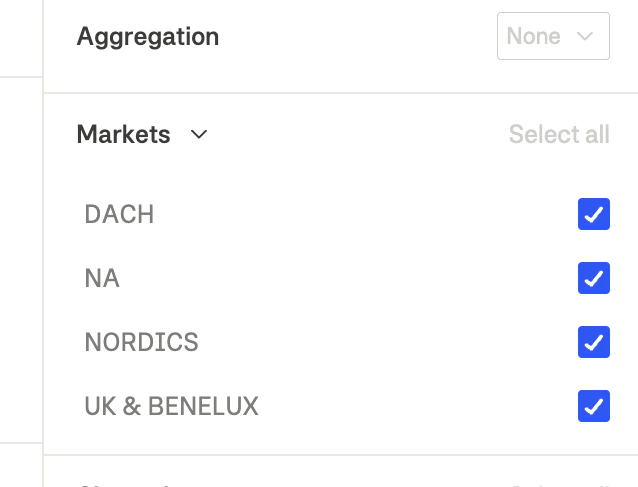
The markets filter lets you focus on specific geographic regions.
| Mode | Description | Use case |
| ----------- | ----------------------------------------------------------- | ------------------------------------------------------------ |
| **Channel** | Data is aggregated by marketing channel across all markets | Compare channel performance across your entire business |
| **Market** | Data is aggregated by geographic market across all channels | Identify which regions have the most optimization potential |
| **None** | Data is shown at the channel × market level (most granular) | Deep-dive analysis into specific channel-market combinations |
### How aggregation affects the view
When you change the aggregation setting:
* **Tables**: Rows will group by your selected dimension (channel or market)
* **Charts**: Visualizations will show data aggregated accordingly
* **Metrics**: Values are summed or averaged based on the aggregation level
Use **Channel** aggregation to compare channel performance across your entire business. Switch to **Market** aggregation to identify which geographic regions have the most optimization potential. Use **None** for the most detailed analysis when you need to see specific channel-market combinations.
***
## Markets filter
The markets filter lets you focus on specific geographic regions.
 ### How to use
1. Open the **View** tab in the right sidebar
2. Find the **Markets** section
3. Check or uncheck markets to include/exclude them from the view
4. Click **Select all** to show all markets
### Available markets
Markets are defined during your MMM onboarding and typically include:
* Geographic regions (e.g., DACH, NORDICS, NA, UK & BENELUX)
* Country-level breakdowns (e.g., US, UK, DE, SE)
When you filter markets, all metrics, charts, and recommendations update to show only the selected markets.
***
## Channels filter
The channels filter lets you focus on specific marketing channels or funnels.
### How to use
1. Open the **View** tab in the right sidebar
2. Find the **Markets** section
3. Check or uncheck markets to include/exclude them from the view
4. Click **Select all** to show all markets
### Available markets
Markets are defined during your MMM onboarding and typically include:
* Geographic regions (e.g., DACH, NORDICS, NA, UK & BENELUX)
* Country-level breakdowns (e.g., US, UK, DE, SE)
When you filter markets, all metrics, charts, and recommendations update to show only the selected markets.
***
## Channels filter
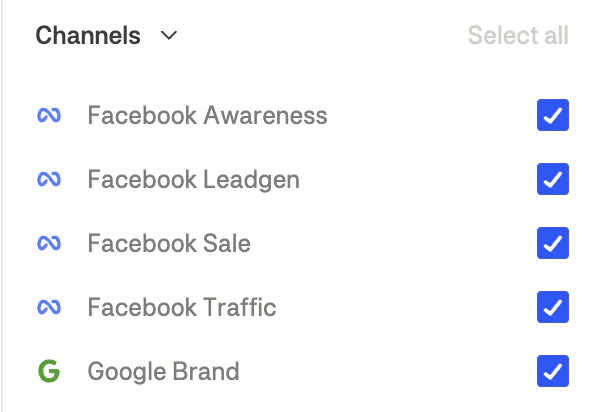
The channels filter lets you focus on specific marketing channels or funnels.
 ### How to use
1. Open the **View** tab in the right sidebar
2. Find the **Channels** section
3. Check or uncheck channels to include/exclude them from the view
4. Click **Select all** to show all channels
***
## Metrics filter
The metrics filter controls which metrics are visible in tables and charts.
### How to use
1. Open the **View** tab in the right sidebar
2. Find the **Channels** section
3. Check or uncheck channels to include/exclude them from the view
4. Click **Select all** to show all channels
***
## Metrics filter
The metrics filter controls which metrics are visible in tables and charts.
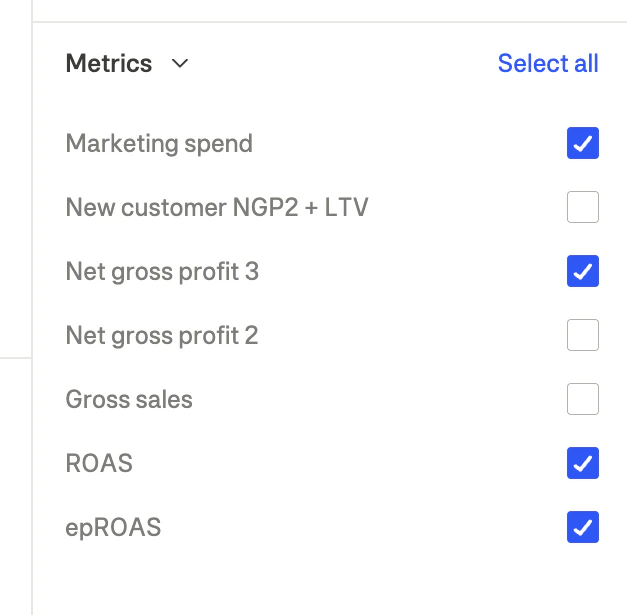 ### Available metrics
| Metric | Description |
| --------------------------- | ------------------------------------------------------ |
| **Marketing spend** | Total marketing spend amount |
| **New customer NGP2 + LTV** | New customer value with lifetime value |
| **Net gross profit 3** | NGP2 minus marketing spend |
| **Net gross profit 2** | Gross sales minus returns, COGS, and fulfillment costs |
| **Gross sales** | Total revenue |
| **ROAS** | Return on ad spend |
| **epROAS** | Effective profit ROAS |
### How to use
1. Open the **View** tab in the right sidebar
2. Find the **Metrics** section
3. Check or uncheck metrics to show/hide them
4. Click **Select all** to show all metrics
***
## Date range selection
The date range picker in the header controls the time period for analysis.
### Available metrics
| Metric | Description |
| --------------------------- | ------------------------------------------------------ |
| **Marketing spend** | Total marketing spend amount |
| **New customer NGP2 + LTV** | New customer value with lifetime value |
| **Net gross profit 3** | NGP2 minus marketing spend |
| **Net gross profit 2** | Gross sales minus returns, COGS, and fulfillment costs |
| **Gross sales** | Total revenue |
| **ROAS** | Return on ad spend |
| **epROAS** | Effective profit ROAS |
### How to use
1. Open the **View** tab in the right sidebar
2. Find the **Metrics** section
3. Check or uncheck metrics to show/hide them
4. Click **Select all** to show all metrics
***
## Date range selection
The date range picker in the header controls the time period for analysis.
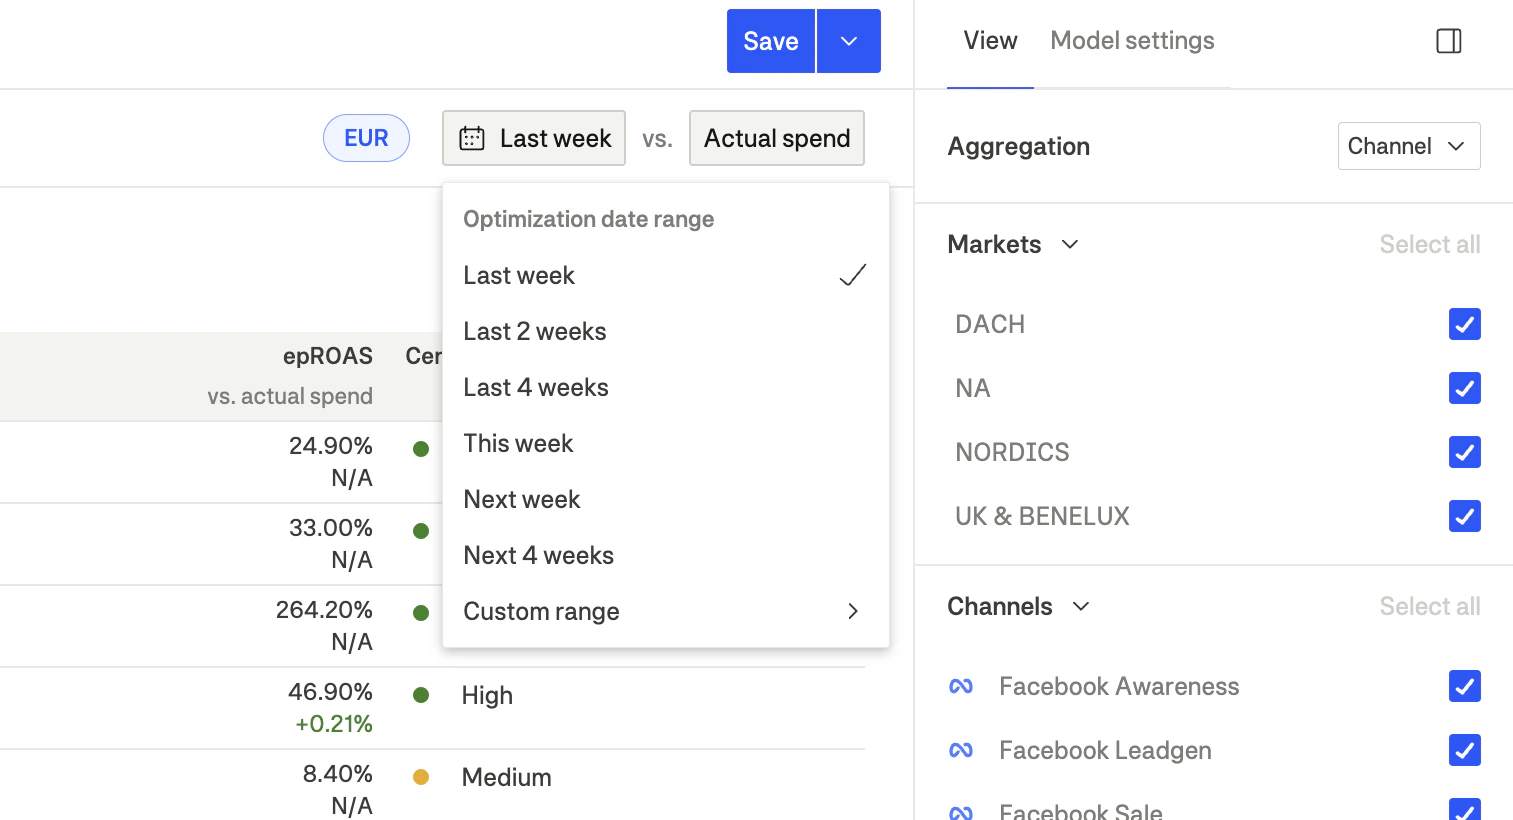 MMM operates on **aggregated weekly data**, with weeks starting on Monday. You can select complete previous weeks for historical reporting, or future weeks to plan upcoming budget allocations.
For **historical analysis**, select past weeks to see what optimal allocation would have achieved compared to your actual spend. This helps you understand missed potential and validate model accuracy.
For **future planning**, select upcoming weeks to get forecasted recommendations based on predicted seasonality and trends. You can also select a custom date range if you need a specific period—just ensure you're selecting complete weeks for accurate analysis.
***
## Saving view preferences
View settings are saved as part of your **MMM configuration**. Adjust filters and aggregation to your preferred view, then click **Save** in the header. Your view preferences will be restored when you return.
MMM operates on **aggregated weekly data**, with weeks starting on Monday. You can select complete previous weeks for historical reporting, or future weeks to plan upcoming budget allocations.
For **historical analysis**, select past weeks to see what optimal allocation would have achieved compared to your actual spend. This helps you understand missed potential and validate model accuracy.
For **future planning**, select upcoming weeks to get forecasted recommendations based on predicted seasonality and trends. You can also select a custom date range if you need a specific period—just ensure you're selecting complete weeks for accurate analysis.
***
## Saving view preferences
View settings are saved as part of your **MMM configuration**. Adjust filters and aggregation to your preferred view, then click **Save** in the header. Your view preferences will be restored when you return.