> ## Documentation Index
> Fetch the complete documentation index at: https://docs.dema.ai/llms.txt
> Use this file to discover all available pages before exploring further.
# Overview view
> Learn how to use Dema's MMM Overview to quickly assess optimization opportunities across markets and channels.
The **Overview** view provides a high-level summary of your marketing optimization opportunities. It shows key metrics, identifies the biggest opportunities, and displays a spend matrix to help you understand where budget reallocation can improve profitability.
Access the Overview by selecting an MMM configuration from the sidebar and ensuring the **Overview** tab is selected.
 ***
## Metric cards
At the top of the Overview, you'll see key performance metrics comparing **optimized vs. actual** performance:
***
## Metric cards
At the top of the Overview, you'll see key performance metrics comparing **optimized vs. actual** performance:
 | Metric | Description |
| ------------------- | ----------------------------------------------------------------------------- |
| **Marketing spend** | Total actual spend vs. recommended optimal spend |
| **ROAS** | Actual return on ad spend vs. what optimal allocation would achieve |
| **epROAS** | Effective profit ROAS comparison (based on your selected optimization target) |
Each metric shows:
* The **optimized value** (what following recommendations would achieve)
* A **percentage change** compared to actual performance (green = improvement, red = decline)
* The **actual value** for reference
A positive change in return metrics indicates potential profit improvement from reallocating spend according to model recommendations.
***
## Opportunities section
The Opportunities section identifies where the biggest optimization potential exists, organized by either **Market** or **Channel**.
| Metric | Description |
| ------------------- | ----------------------------------------------------------------------------- |
| **Marketing spend** | Total actual spend vs. recommended optimal spend |
| **ROAS** | Actual return on ad spend vs. what optimal allocation would achieve |
| **epROAS** | Effective profit ROAS comparison (based on your selected optimization target) |
Each metric shows:
* The **optimized value** (what following recommendations would achieve)
* A **percentage change** compared to actual performance (green = improvement, red = decline)
* The **actual value** for reference
A positive change in return metrics indicates potential profit improvement from reallocating spend according to model recommendations.
***
## Opportunities section
The Opportunities section identifies where the biggest optimization potential exists, organized by either **Market** or **Channel**.
 ### Market view
Shows optimization potential by geographic region:
| Column | Description |
| ----------------------- | ---------------------------------------------------------- |
| **Market** | Geographic region name |
| **Potential** | High/Medium/Low indicator with confidence ring |
| **Potential \[Target]** | Estimated additional profit in your selected target metric |
| **Top opportunities** | The single biggest recommendation for that market |
| **Open** | Link to drill down into that market's details |
### Channel view
Shows optimization potential by marketing channel:
| Column | Description |
| ----------------------- | ---------------------------------------------------------- |
| **Channel** | Marketing channel name with platform icon |
| **Potential** | High/Medium/Low indicator with confidence ring |
| **Potential \[Target]** | Estimated additional profit in your selected target metric |
| **Top opportunities** | The single biggest recommendation for that channel |
| **Open** | Link to drill down into that channel's details |
### Understanding potential indicators
The **Potential** badge shows the confidence level of the optimization opportunity:
| Badge | Meaning |
| ------------------------- | ----------------------------------------------------------------- |
| **High** (full ring) | Strong signal with high confidence—significant untapped potential |
| **Medium** (partial ring) | Moderate signal—opportunity exists but with some uncertainty |
| **Low** (minimal ring) | Weak signal—limited optimization potential detected |
### Top opportunities
The **Top opportunities** column shows the single most impactful action for each market or channel:
* **Increase on \[Channel]**: Model recommends increasing spend on this channel
* **Decrease on \[Channel]**: Model recommends decreasing spend on this channel
The amount shown represents the recommended spend change to capture the potential profit.
Click **Open** next to any market or channel to dive into the Details view for a full breakdown of recommendations.
***
## Spend overview matrix
The Spend overview section displays a heatmap showing recommended spend changes across all markets and channels.
### Market view
Shows optimization potential by geographic region:
| Column | Description |
| ----------------------- | ---------------------------------------------------------- |
| **Market** | Geographic region name |
| **Potential** | High/Medium/Low indicator with confidence ring |
| **Potential \[Target]** | Estimated additional profit in your selected target metric |
| **Top opportunities** | The single biggest recommendation for that market |
| **Open** | Link to drill down into that market's details |
### Channel view
Shows optimization potential by marketing channel:
| Column | Description |
| ----------------------- | ---------------------------------------------------------- |
| **Channel** | Marketing channel name with platform icon |
| **Potential** | High/Medium/Low indicator with confidence ring |
| **Potential \[Target]** | Estimated additional profit in your selected target metric |
| **Top opportunities** | The single biggest recommendation for that channel |
| **Open** | Link to drill down into that channel's details |
### Understanding potential indicators
The **Potential** badge shows the confidence level of the optimization opportunity:
| Badge | Meaning |
| ------------------------- | ----------------------------------------------------------------- |
| **High** (full ring) | Strong signal with high confidence—significant untapped potential |
| **Medium** (partial ring) | Moderate signal—opportunity exists but with some uncertainty |
| **Low** (minimal ring) | Weak signal—limited optimization potential detected |
### Top opportunities
The **Top opportunities** column shows the single most impactful action for each market or channel:
* **Increase on \[Channel]**: Model recommends increasing spend on this channel
* **Decrease on \[Channel]**: Model recommends decreasing spend on this channel
The amount shown represents the recommended spend change to capture the potential profit.
Click **Open** next to any market or channel to dive into the Details view for a full breakdown of recommendations.
***
## Spend overview matrix
The Spend overview section displays a heatmap showing recommended spend changes across all markets and channels.
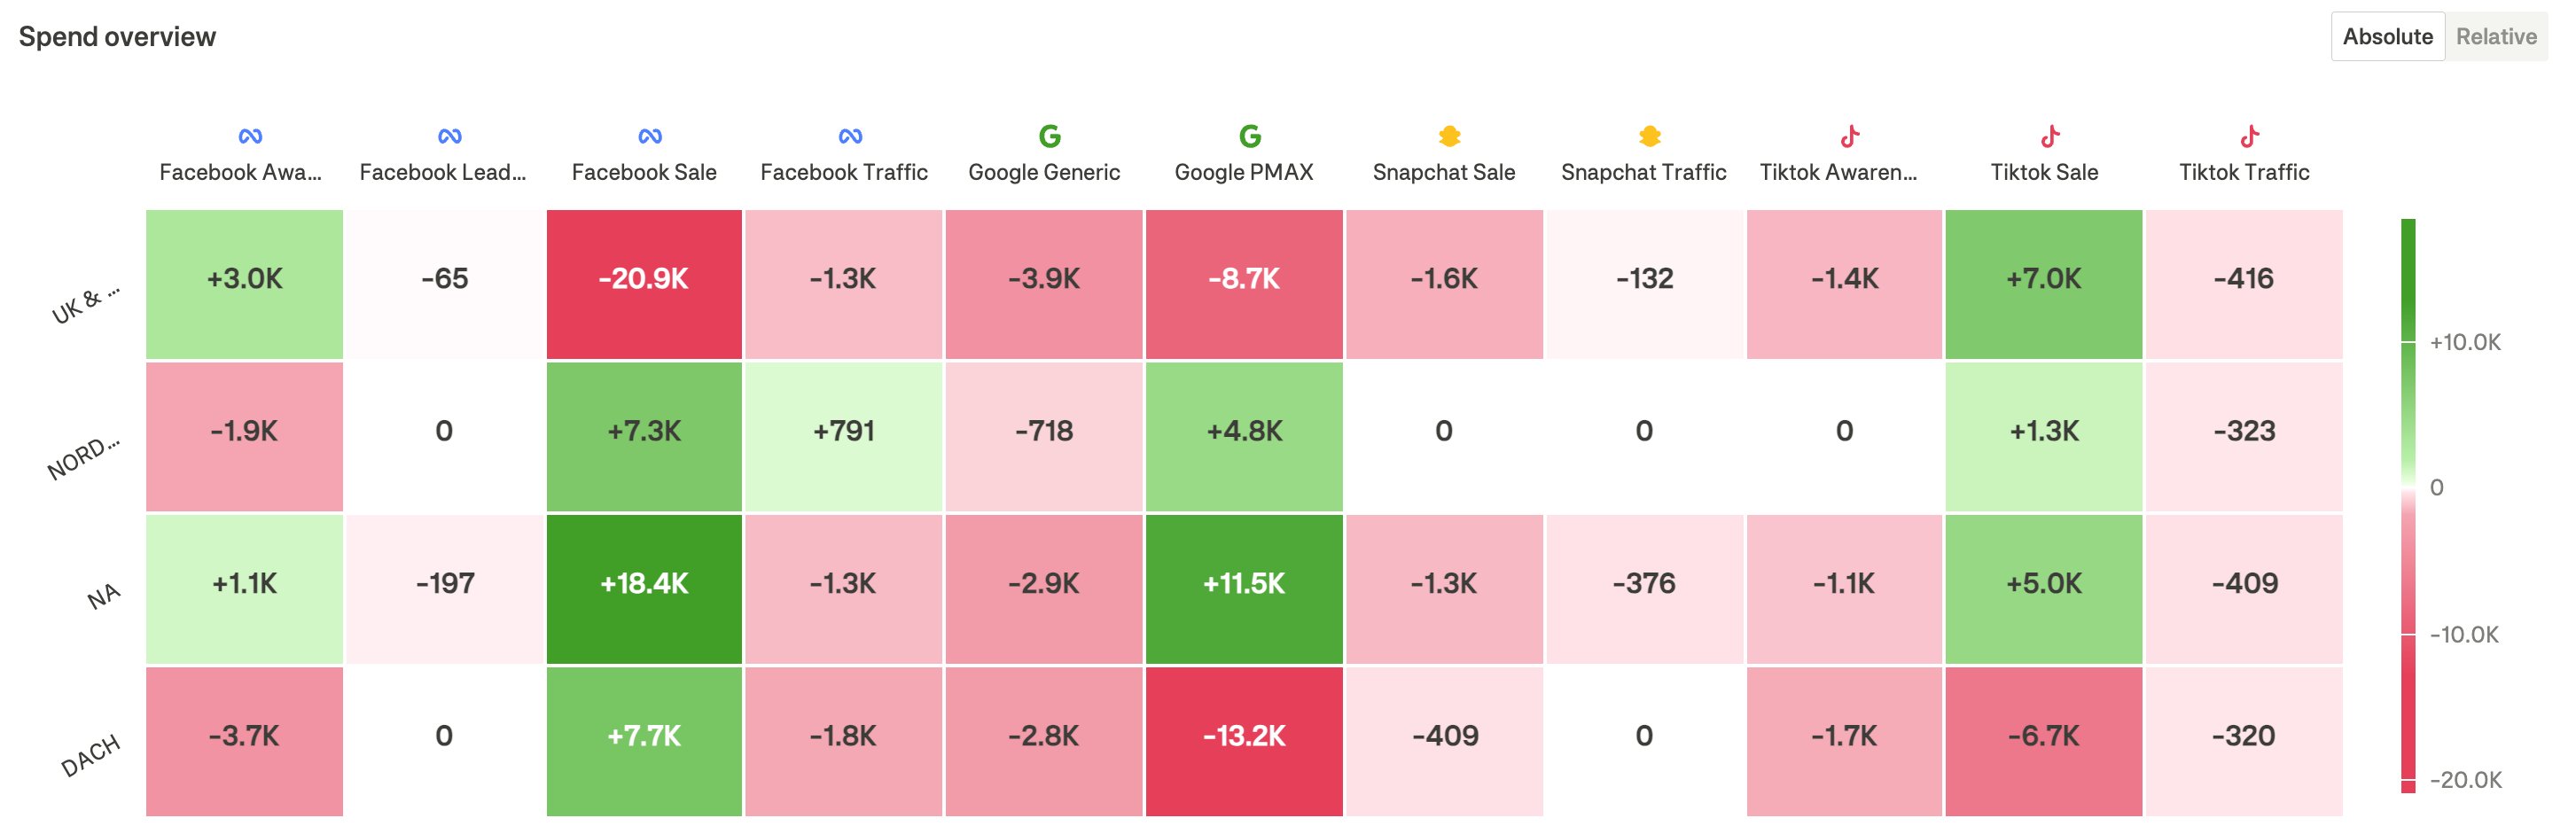 ### Reading the matrix
* **Rows**: Markets (geographic regions)
* **Columns**: Channels (marketing platforms/funnels)
* **Cells**: Recommended spend change
### Color coding
| Color | Meaning |
| -------------- | --------------------------------- |
| **Green** | Increase spend (positive change) |
| **Red** | Decrease spend (negative change) |
| **White/Gray** | No significant change recommended |
The intensity of the color indicates the magnitude of the recommended change—darker colors mean larger changes.
### Absolute vs. Relative toggle
Use the toggle in the section header to switch between:
| Mode | Display |
| ------------ | ------------------------------------------------------ |
| **Absolute** | Shows actual currency amounts (e.g., +€3,000, -€1,500) |
| **Relative** | Shows percentage changes (e.g., +15%, -8%) |
### Interpreting the matrix
1. **Green columns**: Channels that should receive more budget across most markets
2. **Red columns**: Channels that are overspending across most markets
3. **Mixed rows**: Markets where channel mix needs rebalancing
4. **Large values**: Priority areas for attention
The spend matrix respects your configured guardrails. Recommendations won't exceed the maximum spend increase/decrease limits you've set.
***
## Using the Overview effectively
### Quick assessment workflow
1. **Check metric cards**: See if there's significant optimization potential (large positive % changes)
2. **Review opportunities**: Identify which markets or channels have the highest potential
3. **Scan the matrix**: Get a visual sense of where money should flow
4. **Drill down**: Click into specific markets or channels for detailed recommendations
### When to use Overview vs. Details
| Use Overview when... | Use Details when... |
| ----------------------------------------------- | ------------------------------------------------- |
| Starting your weekly review | Implementing specific recommendations |
| Comparing optimization potential across regions | Understanding why a channel needs more/less spend |
| Getting a quick health check | Analyzing saturation curves and adstock effects |
| Reporting to stakeholders | Setting up budget changes in ad platforms |
***
## Filtering the Overview
Use the **View** panel on the right to customize what's shown:
1. **Markets**: Select which markets to include in the analysis
2. **Channels**: Select which channels to include
3. **Metrics**: Choose which metrics to display in cards
The Opportunities section and Spend matrix will update to reflect your filter selections.
Create filtered views for specific regions or channel groups to focus your analysis. For example, filter to only Meta channels to assess your social media optimization opportunities.
***
## Date range selection
Use the date picker in the header to change the analysis period:
* **Historical periods** (Last week, Last 2/4 weeks): Shows what optimal allocation would have achieved compared to actual spend
* **Future periods** (Next week, Next 4 weeks): Shows recommended allocation for upcoming periods based on forecasted conditions
Future period recommendations incorporate predicted seasonality and trends, making them ideal for planning upcoming budget changes.
### Reading the matrix
* **Rows**: Markets (geographic regions)
* **Columns**: Channels (marketing platforms/funnels)
* **Cells**: Recommended spend change
### Color coding
| Color | Meaning |
| -------------- | --------------------------------- |
| **Green** | Increase spend (positive change) |
| **Red** | Decrease spend (negative change) |
| **White/Gray** | No significant change recommended |
The intensity of the color indicates the magnitude of the recommended change—darker colors mean larger changes.
### Absolute vs. Relative toggle
Use the toggle in the section header to switch between:
| Mode | Display |
| ------------ | ------------------------------------------------------ |
| **Absolute** | Shows actual currency amounts (e.g., +€3,000, -€1,500) |
| **Relative** | Shows percentage changes (e.g., +15%, -8%) |
### Interpreting the matrix
1. **Green columns**: Channels that should receive more budget across most markets
2. **Red columns**: Channels that are overspending across most markets
3. **Mixed rows**: Markets where channel mix needs rebalancing
4. **Large values**: Priority areas for attention
The spend matrix respects your configured guardrails. Recommendations won't exceed the maximum spend increase/decrease limits you've set.
***
## Using the Overview effectively
### Quick assessment workflow
1. **Check metric cards**: See if there's significant optimization potential (large positive % changes)
2. **Review opportunities**: Identify which markets or channels have the highest potential
3. **Scan the matrix**: Get a visual sense of where money should flow
4. **Drill down**: Click into specific markets or channels for detailed recommendations
### When to use Overview vs. Details
| Use Overview when... | Use Details when... |
| ----------------------------------------------- | ------------------------------------------------- |
| Starting your weekly review | Implementing specific recommendations |
| Comparing optimization potential across regions | Understanding why a channel needs more/less spend |
| Getting a quick health check | Analyzing saturation curves and adstock effects |
| Reporting to stakeholders | Setting up budget changes in ad platforms |
***
## Filtering the Overview
Use the **View** panel on the right to customize what's shown:
1. **Markets**: Select which markets to include in the analysis
2. **Channels**: Select which channels to include
3. **Metrics**: Choose which metrics to display in cards
The Opportunities section and Spend matrix will update to reflect your filter selections.
Create filtered views for specific regions or channel groups to focus your analysis. For example, filter to only Meta channels to assess your social media optimization opportunities.
***
## Date range selection
Use the date picker in the header to change the analysis period:
* **Historical periods** (Last week, Last 2/4 weeks): Shows what optimal allocation would have achieved compared to actual spend
* **Future periods** (Next week, Next 4 weeks): Shows recommended allocation for upcoming periods based on forecasted conditions
Future period recommendations incorporate predicted seasonality and trends, making them ideal for planning upcoming budget changes.