> ## Documentation Index
> Fetch the complete documentation index at: https://docs.dema.ai/llms.txt
> Use this file to discover all available pages before exploring further.
# Configuring calibration settings
> Step-by-step guide to setting up causal factor attribution calibrations: from reading the benchmark distribution to saving your configuration.
## Accessing calibration settings
Navigate to **Settings > Causal factor attribution** in the Dema app to open the calibration configuration panel.
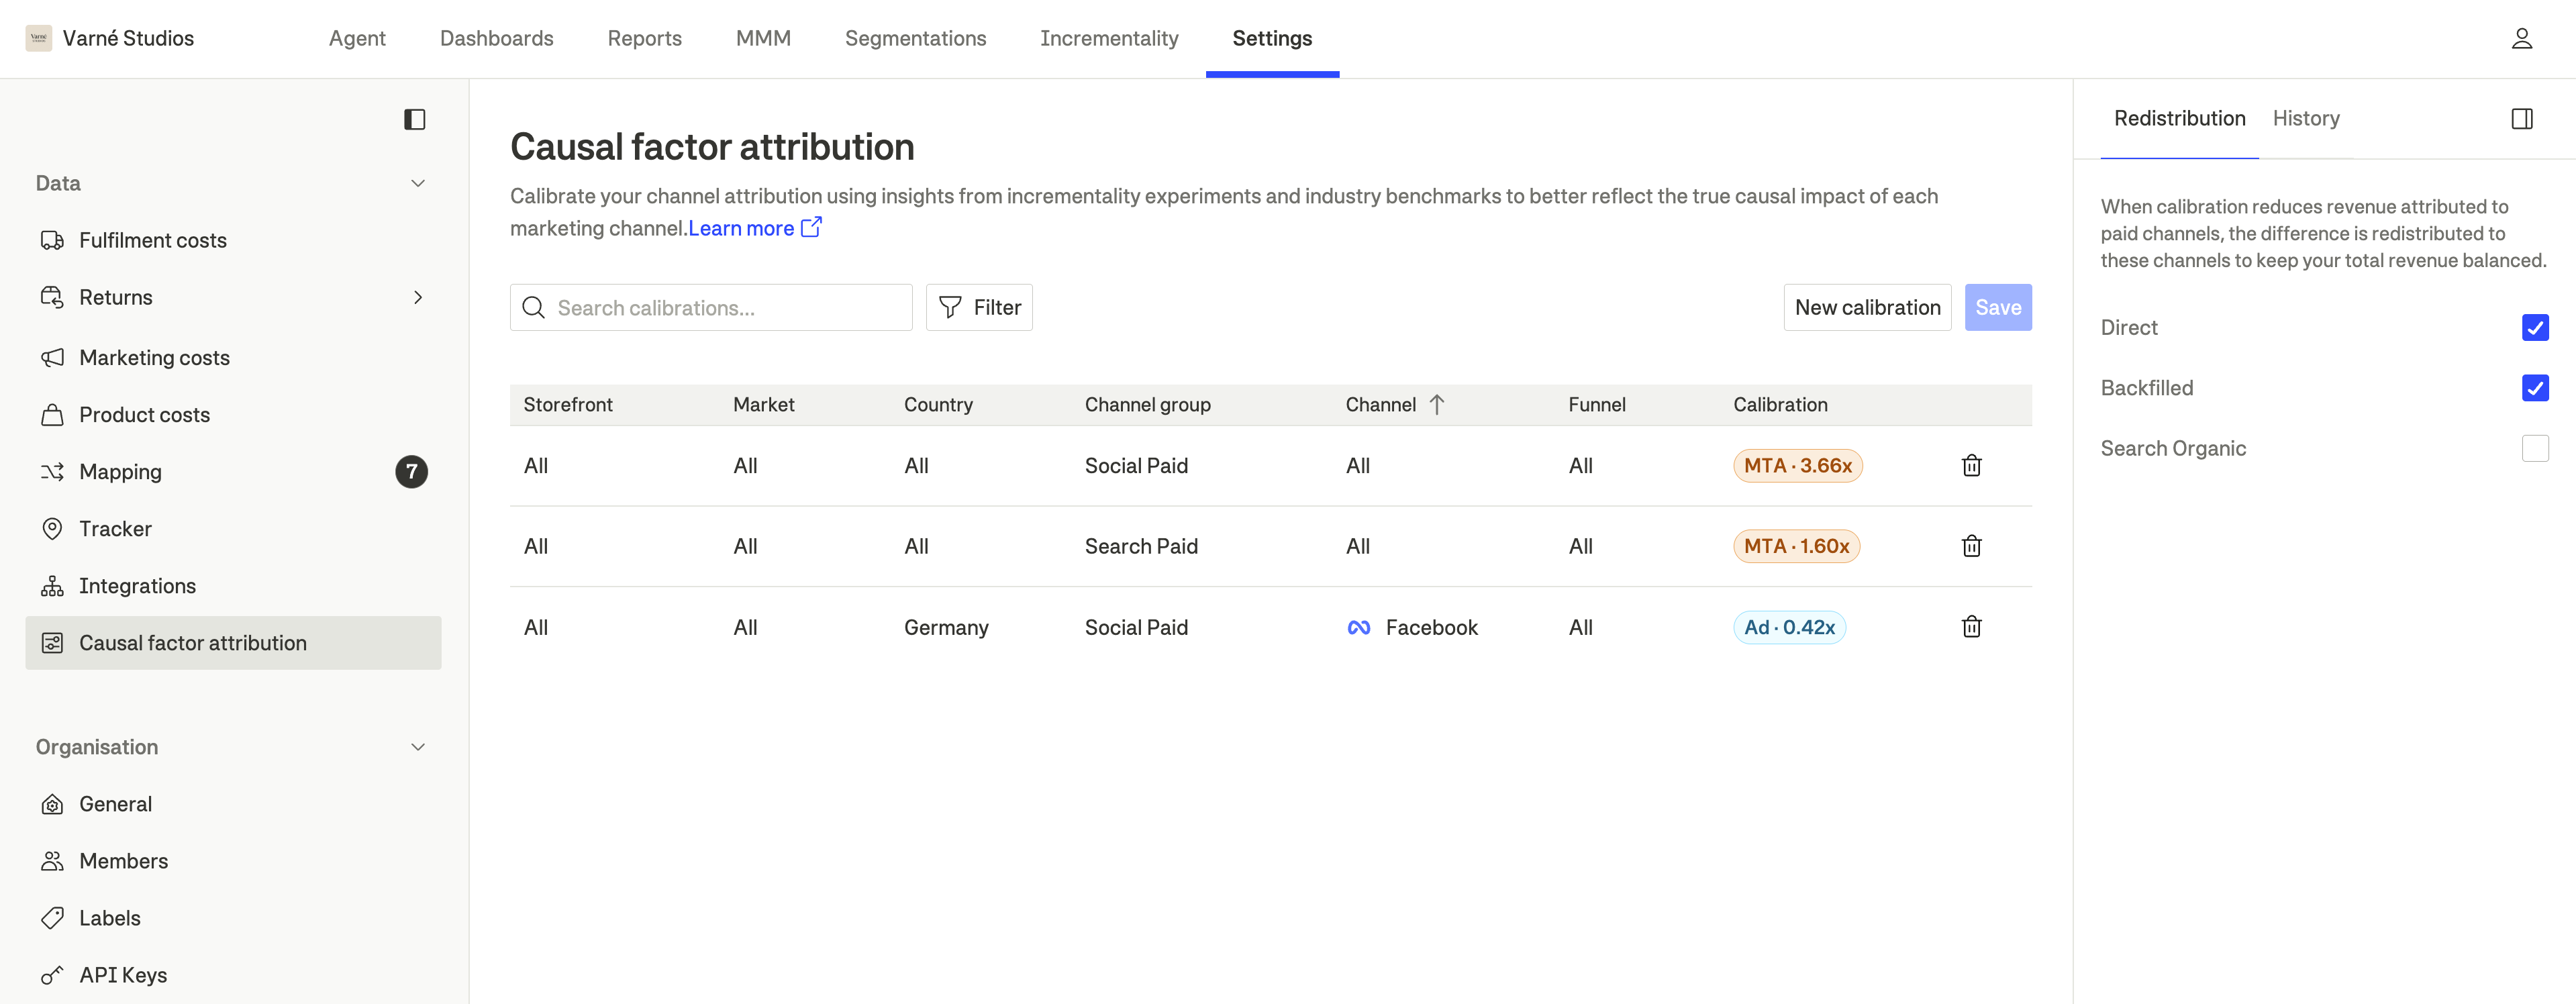 Here you'll see your current calibration rules, source channel groups, and the ability to add, edit, or remove calibrations.
***
## Understanding the benchmark distribution
Before setting any multiplier, review the **incremental factor distribution** shown for each channel. This bell curve represents the expected incremental ROAS based on:
1. **Platform-wide experiments** - Dema's benchmark from all finalized incrementality experiments matching the channel
2. **Your own experiments** - If you've run incrementality experiments, they refine the distribution and narrow the curve
Here you'll see your current calibration rules, source channel groups, and the ability to add, edit, or remove calibrations.
***
## Understanding the benchmark distribution
Before setting any multiplier, review the **incremental factor distribution** shown for each channel. This bell curve represents the expected incremental ROAS based on:
1. **Platform-wide experiments** - Dema's benchmark from all finalized incrementality experiments matching the channel
2. **Your own experiments** - If you've run incrementality experiments, they refine the distribution and narrow the curve
 Even if you haven't run any incrementality experiments yet, Dema provides a benchmarked distribution based on experiments across the platform. This gives you a data-driven starting point rather than guessing.
**Reading the bell curve:**
* The **peak** represents the most likely incremental ROAS for this channel
* A **wide curve** means more uncertainty (fewer or more varied experiments)
* A **narrow curve** means high confidence (many consistent experiments)
* The **mean** is the recommended calibration starting point
You can also switch between reference metrics to view the distribution in terms of:
| Reference metric | What it measures |
| ---------------- | -------------------------------------------------- |
| **ROAS** | Incremental return on ad spend (revenue per spend) |
| **Gross sales** | Absolute incremental gross sales value |
***
## Adding a calibration rule
Click **New calibration** to create a new rule. Each rule targets a specific scope of your marketing data.
Even if you haven't run any incrementality experiments yet, Dema provides a benchmarked distribution based on experiments across the platform. This gives you a data-driven starting point rather than guessing.
**Reading the bell curve:**
* The **peak** represents the most likely incremental ROAS for this channel
* A **wide curve** means more uncertainty (fewer or more varied experiments)
* A **narrow curve** means high confidence (many consistent experiments)
* The **mean** is the recommended calibration starting point
You can also switch between reference metrics to view the distribution in terms of:
| Reference metric | What it measures |
| ---------------- | -------------------------------------------------- |
| **ROAS** | Incremental return on ad spend (revenue per spend) |
| **Gross sales** | Absolute incremental gross sales value |
***
## Adding a calibration rule
Click **New calibration** to create a new rule. Each rule targets a specific scope of your marketing data.
 ### Defining the scope
Each calibration rule can be scoped at multiple levels of granularity:
* **Channel group** - Marketing category (e.g. Paid Social, Paid Search, Display)
* **Channel** - Specific ad platform (e.g. Meta, Google, TikTok)
* **Funnel campaign** - Campaign funnel stage (e.g. Lower funnel, Upper funnel)
* **Market** - Geographic market (e.g. SE, DE, US)
* **Country** - Specific country (e.g. Sweden, Germany)
* **Storefront** - Specific storefront (your store identifier)
Leave any field set to **All** to apply the rule broadly. For example, setting channel group to "Paid Social" and leaving everything else as All applies the calibration to all paid social channels across all markets.
### Specificity matching
When multiple rules could match a data row, the **most specific rule wins**. Specificity is determined by how many fields are set to specific values (not set to All).
**Example:**
* Rule A: Paid Social / All / All / All with multiplier 0.8
* Rule B: Paid Social / Meta / All / SE with multiplier 0.6
For Meta traffic in Sweden, Rule B applies (more specific). For other paid social traffic in Germany, Rule A applies (only match).
***
## Choosing the calibration type
For each rule, select how the calibration is applied:
Multiplies the MTA-attributed value by the multiplier.
**Best for:** Channels where MTA captures the journey well but over- or under-attributes the conversion.
Uses the ad platform's reported value as the base, then applies the multiplier.
**Best for:** Channels where ad platform reporting is more reliable than MTA tracking (e.g., limited cookie visibility).
### Defining the scope
Each calibration rule can be scoped at multiple levels of granularity:
* **Channel group** - Marketing category (e.g. Paid Social, Paid Search, Display)
* **Channel** - Specific ad platform (e.g. Meta, Google, TikTok)
* **Funnel campaign** - Campaign funnel stage (e.g. Lower funnel, Upper funnel)
* **Market** - Geographic market (e.g. SE, DE, US)
* **Country** - Specific country (e.g. Sweden, Germany)
* **Storefront** - Specific storefront (your store identifier)
Leave any field set to **All** to apply the rule broadly. For example, setting channel group to "Paid Social" and leaving everything else as All applies the calibration to all paid social channels across all markets.
### Specificity matching
When multiple rules could match a data row, the **most specific rule wins**. Specificity is determined by how many fields are set to specific values (not set to All).
**Example:**
* Rule A: Paid Social / All / All / All with multiplier 0.8
* Rule B: Paid Social / Meta / All / SE with multiplier 0.6
For Meta traffic in Sweden, Rule B applies (more specific). For other paid social traffic in Germany, Rule A applies (only match).
***
## Choosing the calibration type
For each rule, select how the calibration is applied:
Multiplies the MTA-attributed value by the multiplier.
**Best for:** Channels where MTA captures the journey well but over- or under-attributes the conversion.
Uses the ad platform's reported value as the base, then applies the multiplier.
**Best for:** Channels where ad platform reporting is more reliable than MTA tracking (e.g., limited cookie visibility).
 ***
## Setting the multiplier
Use the **slider** to set the calibration multiplier. The bell curve distribution is shown alongside to help you choose an appropriate value.
***
## Setting the multiplier
Use the **slider** to set the calibration multiplier. The bell curve distribution is shown alongside to help you choose an appropriate value.
 **Guidelines for setting the multiplier:**
| Multiplier | Meaning | When to use |
| ---------- | --------------------- | --------------------------------------------------------------------------- |
| **1.0** | No adjustment | MTA values are already accurate |
| **\< 1.0** | Reduce contribution | Channel gets more credit than it causally drives (common for retargeting) |
| **> 1.0** | Increase contribution | Channel drives more than MTA captures (common for upper-funnel / awareness) |
The benchmark distribution's **mean** is a good default starting point. If you've run your own incrementality experiments and they align with the benchmark, you can be more confident in using the mean. If your results diverge, favor your own experimental data.
***
## Source channel groups
Source channel groups are channels that **absorb the redistribution delta** when other channels are calibrated. By default, these are typically:
* **Direct** - Direct / type-in traffic
* **Other unattributed** - Sessions with no attributed marketing touchpoint
When you increase a paid channel's contribution, the same amount is subtracted proportionally from source channels. This ensures daily totals are always conserved.
If the total calibration delta exceeds what source channels can absorb, the system automatically caps adjustments. This prevents any channel from going negative.
***
## Version history
Every time you save a calibration configuration, a new **version** is created. You can:
* **View previous versions** to see how your calibrations have changed over time
* **Restore a previous version** to revert to an earlier configuration
* **See who saved each version** for audit purposes
**Guidelines for setting the multiplier:**
| Multiplier | Meaning | When to use |
| ---------- | --------------------- | --------------------------------------------------------------------------- |
| **1.0** | No adjustment | MTA values are already accurate |
| **\< 1.0** | Reduce contribution | Channel gets more credit than it causally drives (common for retargeting) |
| **> 1.0** | Increase contribution | Channel drives more than MTA captures (common for upper-funnel / awareness) |
The benchmark distribution's **mean** is a good default starting point. If you've run your own incrementality experiments and they align with the benchmark, you can be more confident in using the mean. If your results diverge, favor your own experimental data.
***
## Source channel groups
Source channel groups are channels that **absorb the redistribution delta** when other channels are calibrated. By default, these are typically:
* **Direct** - Direct / type-in traffic
* **Other unattributed** - Sessions with no attributed marketing touchpoint
When you increase a paid channel's contribution, the same amount is subtracted proportionally from source channels. This ensures daily totals are always conserved.
If the total calibration delta exceeds what source channels can absorb, the system automatically caps adjustments. This prevents any channel from going negative.
***
## Version history
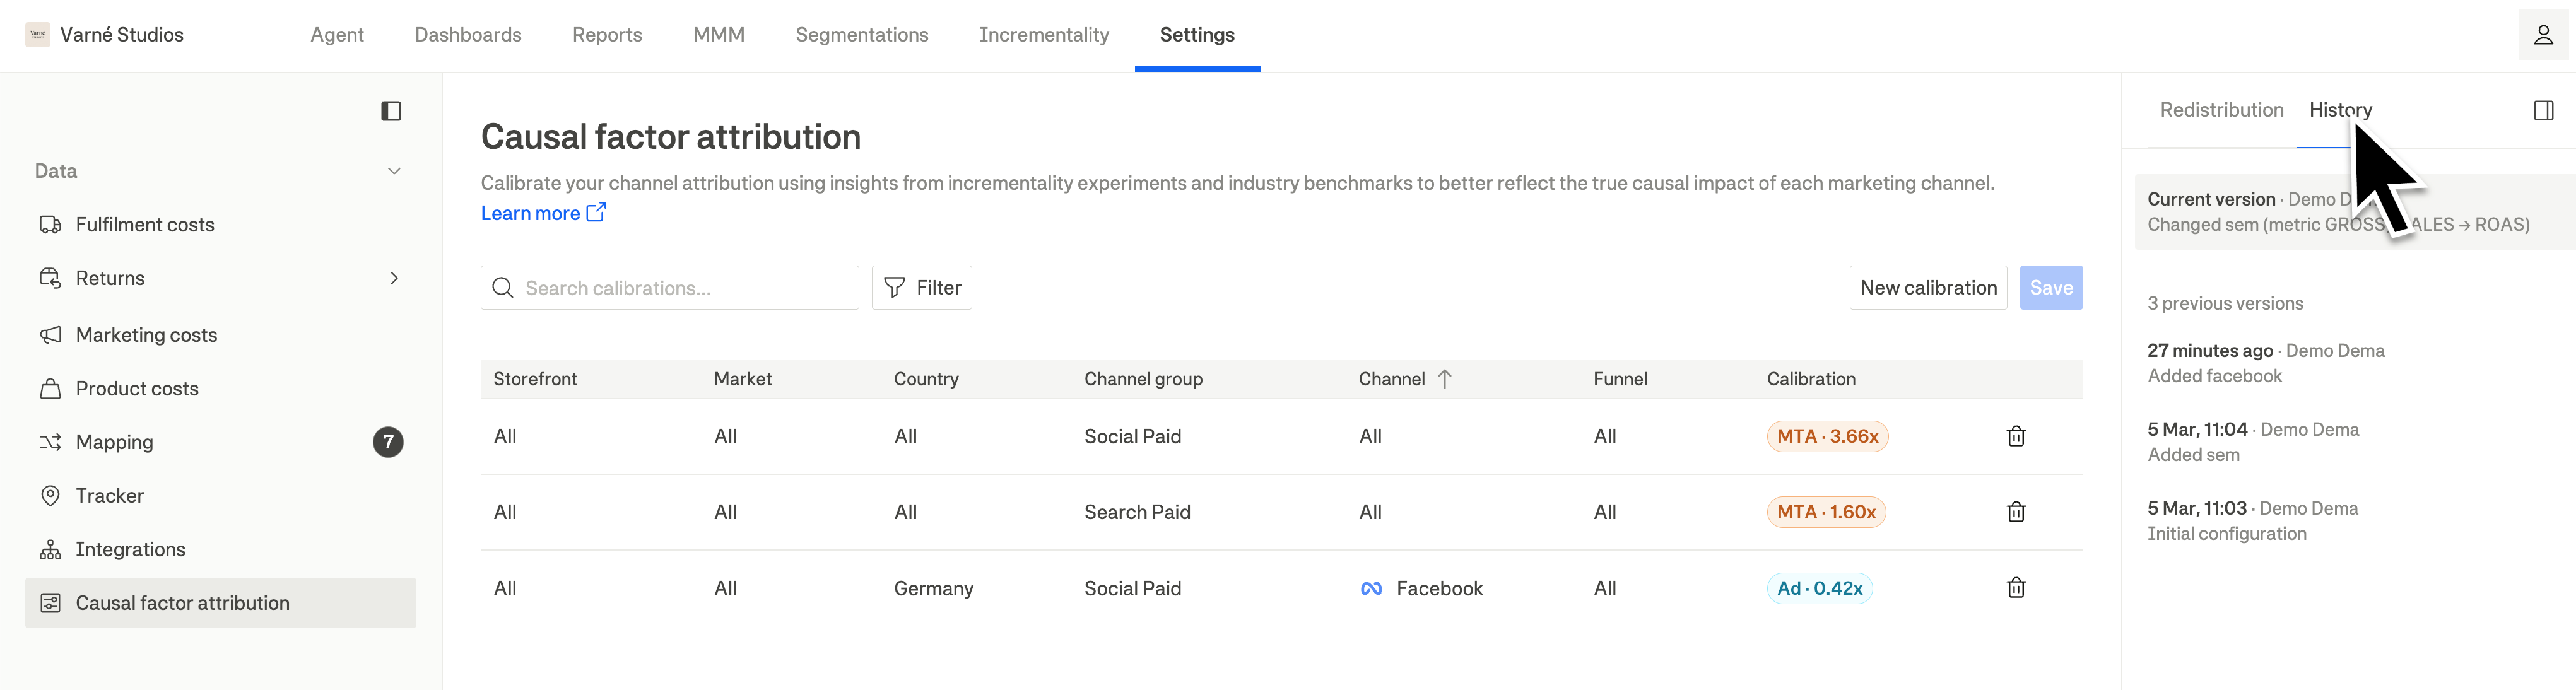
Every time you save a calibration configuration, a new **version** is created. You can:
* **View previous versions** to see how your calibrations have changed over time
* **Restore a previous version** to revert to an earlier configuration
* **See who saved each version** for audit purposes
 ***
## Saving your configuration
After configuring your calibration rules, click **Save** to persist your changes. The new configuration:
1. Is stored as a new version (the previous configuration is preserved in history)
2. Takes effect on the next pipeline run (once a day every morning)
3. Applies to all future attribution calculations until changed again
Verify that each calibration rule targets the correct scope and has an appropriate multiplier based on the benchmark distribution or your experiment results.
Ensure your source channel groups are configured correctly. In most cases, direct and other unattributed traffic are the right choices.
Click **Save** to create a new configuration version. Your changes will take effect on the next scheduled pipeline run.
***
## Saving your configuration
After configuring your calibration rules, click **Save** to persist your changes. The new configuration:
1. Is stored as a new version (the previous configuration is preserved in history)
2. Takes effect on the next pipeline run (once a day every morning)
3. Applies to all future attribution calculations until changed again
Verify that each calibration rule targets the correct scope and has an appropriate multiplier based on the benchmark distribution or your experiment results.
Ensure your source channel groups are configured correctly. In most cases, direct and other unattributed traffic are the right choices.
Click **Save** to create a new configuration version. Your changes will take effect on the next scheduled pipeline run.